Bado haijatafsiriwa: toleo asili la Kiingereza.
YOUR BIOLOGICAL AGE MAY BE LYING
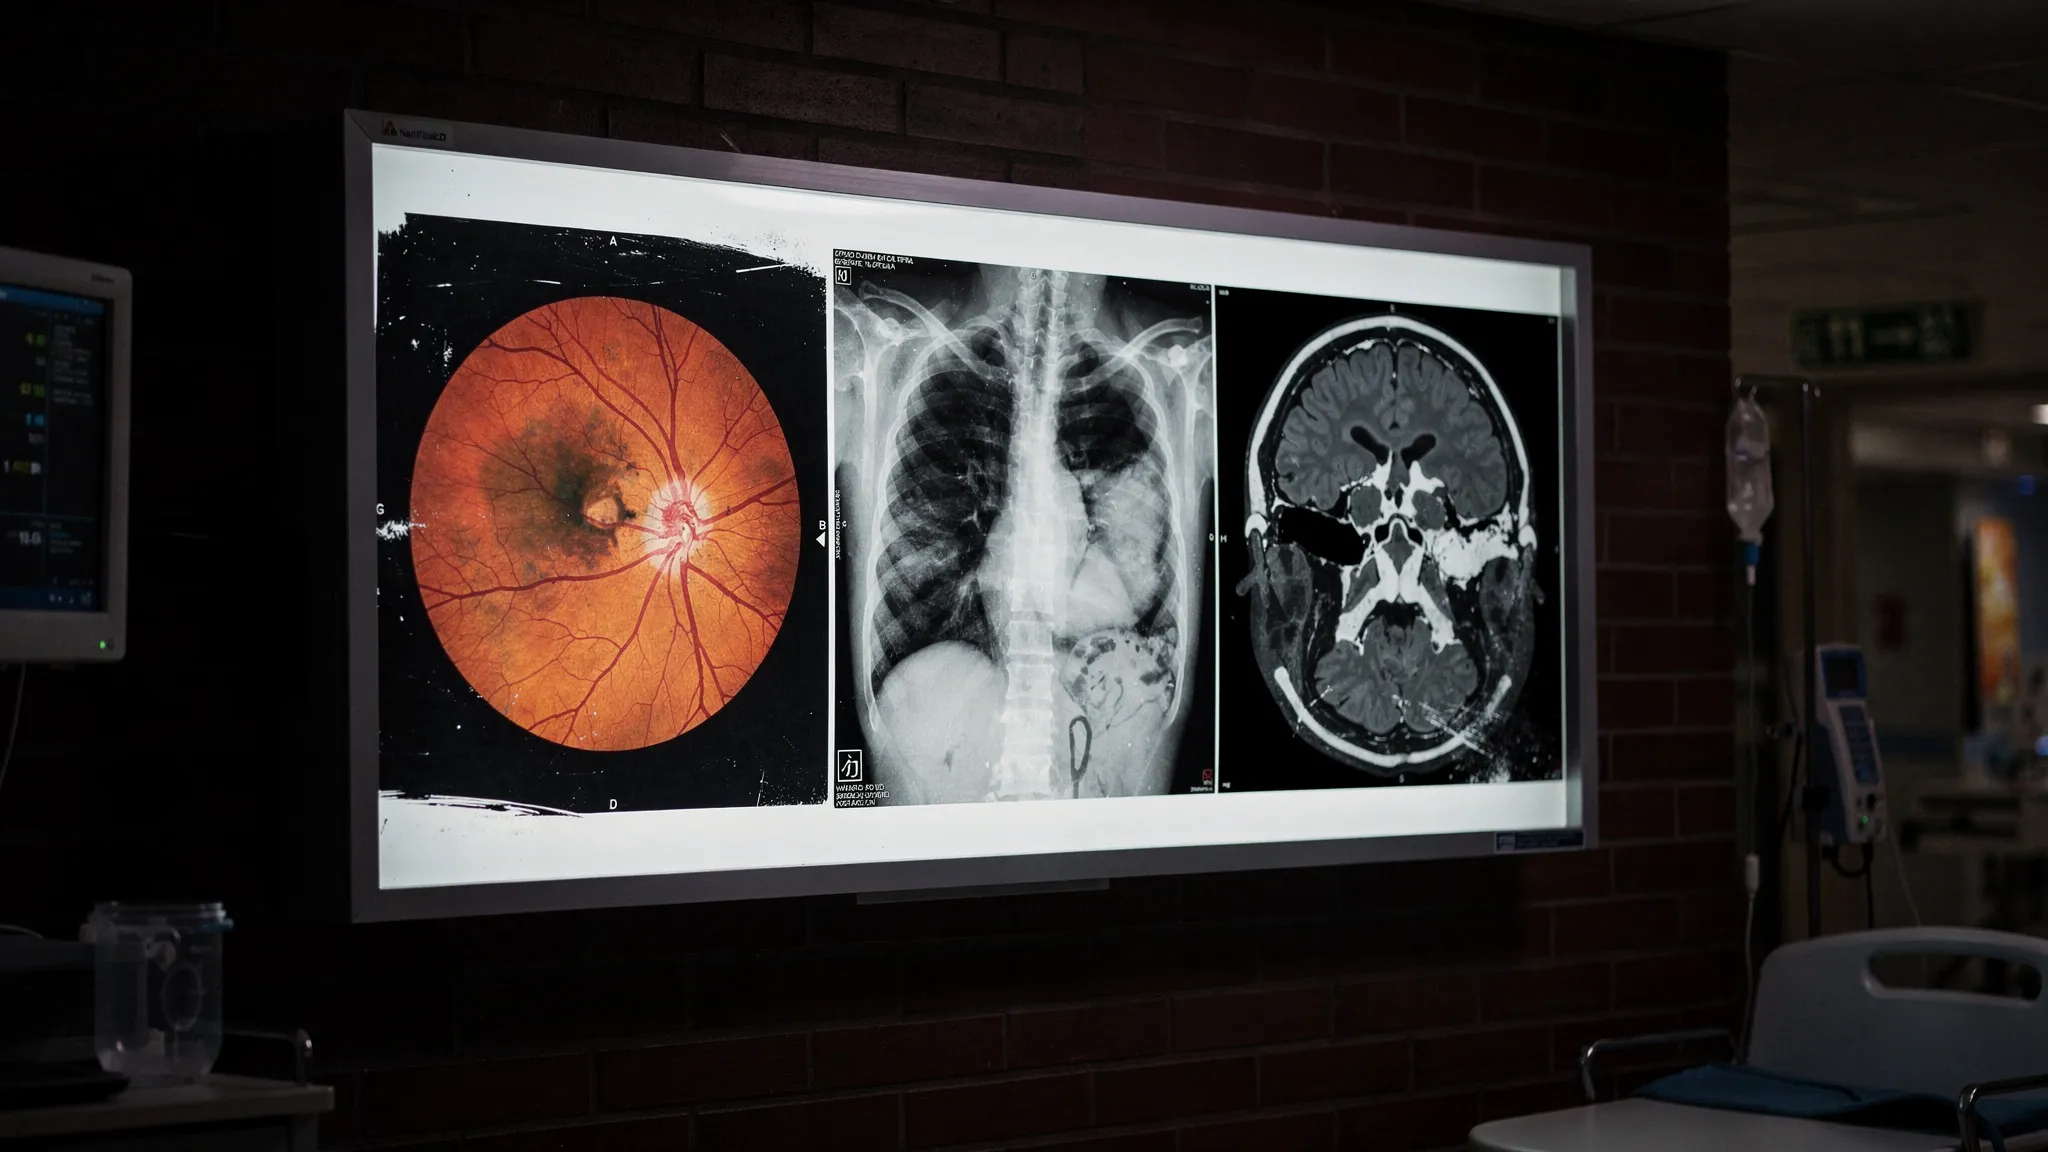
An algorithm looks at a photo of the back of your eye and estimates your age. If it says 60 while you are 55, the five-year “age gap” is read as a sign that your body is ageing faster than it should. Such biological ageing markers, or “ageing clocks”, now exist for the eye, the brain, the chest, the abdomen and the blood, and studies have linked larger age gaps to disease and death.
A study by 55 researchers, led from University College London and Moorfields Eye Hospital, finds a flaw in how these clocks are read.
Five clocks, five cohorts
The team built or used five markers:
- Retinal Age, from photos of the back of the eye (65,360 images from 12,141 patients in London);
- Chest Age, from chest X-rays (21,733 images);
- Abdominal Age, from abdominal CT scans (4,984 scans);
- Brain Age, from brain MRI (1,454 scans from 808 people);
- PhenoAge, a published formula combining age with nine routine blood tests (41,512 UK Biobank participants).
The four organ clocks are deep-learning models trained only on people with no recorded disease, then tested on a mix of healthy and sick people. As in earlier studies, all five showed that a larger age gap goes with poorer health — on average, across the whole cohort.
A pull toward the middle
Every statistical model of this kind suffers from regression to the mean: its estimates are pulled toward the average age of its training data. Young people look a bit older than they are, old people a bit younger. This was known, and corrections exist.
What the team found is that the pull is not the same for everyone. In all four organ clocks, the age gap shrank with age faster in sick people than in healthy ones. For Retinal Age, for instance, the gap fell by 0.31 years per year of age in the sick group, against 0.18 in the healthy group. The authors call this differential regression to the mean. Their explanation: signs of disease make an image harder to read for a model trained on healthy people, so its estimate is pulled more strongly toward the average.
An association that fades — or flips
The consequence shows up when the data are split by age. For Retinal Age, each extra year of age gap raised the odds of being sick by 11% below age 50, but the link vanished at 80 and over. For Chest Age, it was positive below 40, absent between 40 and 70, and reversed after 70: an “older-looking” chest X-ray then went slightly with better health. Abdominal Age followed a similar fading pattern.
Brain Age was the exception: the association stayed positive at every age. Both the gap between groups and the spread of values shrank together, so their ratio held steady. Differential regression to the mean can distort the picture, the authors conclude, but does not always.
No easy fix
The researchers tried the usual remedies on Retinal Age. Recalibrating the age gap flattened the trend in healthy people but left the sick group’s trend in place. Retraining the model on a perfectly balanced spread of ages made the bias slightly larger. The same held for the other three organ clocks. The blood-based PhenoAge, which takes chronological age as a direct input rather than estimating it, showed no such bias.
One person is not a cohort
The most striking test compares individuals. Within each age band, the team paired every healthy person with every sick one. In every clock and every age band, the healthy person had the larger age gap in at least a quarter of the pairs. For Retinal Age at 80 and over, it happened in 59% of pairs — more often than not. Some healthy patients appeared 8.8 to 16.4 years “older” than a sick patient of the same age. Even PhenoAge got the order wrong in 39 to 41% of pairs.
Read the clock by age
The authors call for associations to be reported within age bands rather than for whole cohorts, and suggest adding an age-by-age-gap interaction term to models — on retinal data, it recovered most of the lost performance in the oldest group. Their study has limits: “healthy” only means no recorded disease, each clock was tested on a single cohort, and the analyses are cross-sectional. Their conclusion is blunt all the same: none of these clocks can yet tell, on its own, how healthy one particular person is.