A FAINT HINT OF THE NEUTRINOS LEFT BY ALL PAST SUPERNOVAE
A few times every second, somewhere in the observable universe, the core of a star collapses. Each collapse is expected to release an enormous amount of energy, around 10⁵³ erg (10⁴⁶ joules), about 99% of it carried off by neutrinos, near-massless particles that pass through almost all matter. Yet bursts of neutrinos from nearby supernovae arrive only a few times per century. Since the 24 neutrinos caught from supernova SN 1987A, catching supernova neutrinos again has been a central goal of neutrino astronomy.
The sum of every collapse since stars began to form
There is another way in. Add up the neutrinos of all the core collapses since star formation began, and you get the diffuse supernova neutrino background (DSNB): a steady flux arriving equally from every direction. Its spectrum — how many neutrinos at each energy — would say something about how stars collapse, what fraction of collapses form black holes, and how the chemistry of galaxies evolved.
Many predictions exist. Searches have been run in water and liquid-scintillator detectors, but until now none had found a significant excess, and this one, as shown below, is still only a hint.
A flash, then a neutron
A collapse emits every type of neutrino. Most searches, this one included, target one of them, the electron antineutrino (ν̄e), through a reaction on a proton:
ν̄e + p → e⁺ + n
The proton becomes a positron (e⁺, a positively charged electron) and a neutron. In the energy range that matters here, roughly 10 to 30 MeV (millions of electronvolts), this reaction is about a hundred times more likely than a neutrino bouncing off an electron.
Super-Kamiokande (SK) is a giant tank of water watched by light sensors, in the Kamioka mine, in Gifu, Japan; the analysis keeps 22.5 kilotonnes of its water. A fast charged particle crossing the water gives off a faint cone of light, called Cherenkov light: the positron’s is recorded by photomultiplier tubes (the light sensors). The neutron is captured a little later by an atomic nucleus, which releases a second, fainter burst of light: after about 200 microseconds in pure water, about 60 once gadolinium, a metal that catches neutrons far more readily, is dissolved in it, at 0.033%. Seeing the flash and then the capture — “neutron tagging” — matters, because the expected signal is only a few events per year.
5,003 days in six phases
The data run from October 2008 to March 2026: 5,003.0 days of recording, in six phases. The first two used pure water. Then gadolinium sulfate was dissolved into it: 13 tons, then 26.1 tons more, which raised the share of neutrons captured by gadolinium from 50% to 75%. The share of neutrons tagged rose with it: 10–30% in pure water, 60–70% at the highest concentration. In October 2023, a failure of the coils that cancel the Earth’s magnetic field around the detector dimmed some sensors for 191.8 days, until repairs.
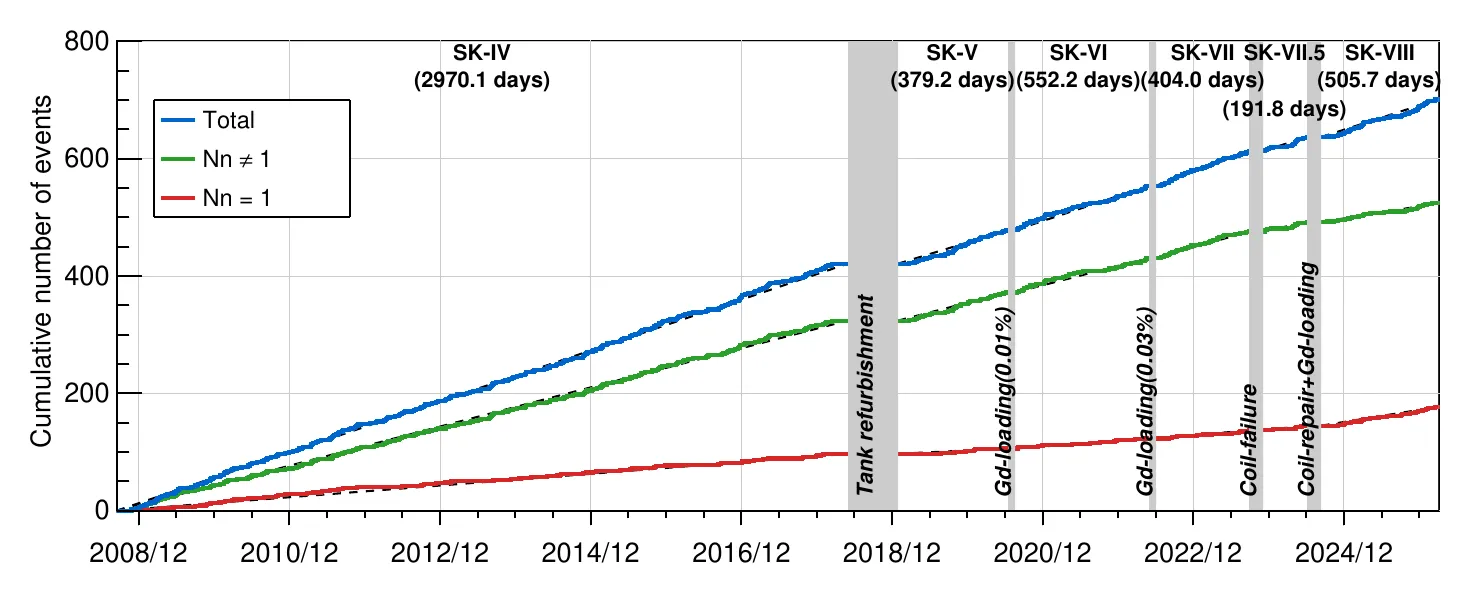
Candidate events piling up over the six phases: total (blue), with exactly one tagged neutron (red) or not (green); the red line steepens after the gadolinium loadings. — Figure 4, Abe et al. (2026), arXiv:2610.35619.
Impostors a million times more common
Cosmic-ray muons (heavier cousins of the electron, made when cosmic rays strike the upper atmosphere) break oxygen nuclei in the water into radioactive isotopes whose decays outnumber the expected signal by up to a million to one below about 20 MeV. Most emit no neutron, so requiring one removes them. Lithium-9 is the exception: it decays into an electron and a neutron, a perfect copy of the signal (half-life: 0.178 seconds).
Atmospheric neutrinos are the other trap. Some knock a neutron out of a nucleus and release gamma rays, faking the flash-and-neutron pair. Others create a muon, which decays within microseconds into an electron; with a neutron, that pair also mimics the signal. The new analysis adds:
- a machine-learning filter for these gamma-ray impostors, which keeps 89% of the real signal instead of 79% and halves the impostors left, from 10% to 5%;
- a way to tell a muon’s decay electron from a gadolinium capture, instead of cutting events that once cost about 10% of the signal;
- tighter uncertainties: 45% instead of 70% on the rate of these atmospheric events, 30% instead of 50% on the lithium-9 left over.
One choice runs the other way. In the pure-water years, among events without exactly one tagged neutron, the fit found an extra contribution at measured energies between 15.5 and 21.5 MeV, about as large as the supernova signal expected there — most likely, say the authors, leftover cosmic-ray debris that their model misses. They raised the threshold for those events to 21.5 MeV in every phase, and lowered it from 15.5 to 11.5 MeV for events with exactly one tagged neutron. Together, the two changes cost 13.9% of the expected signal.
What 2.6 sigma says, and what it does not
The final fit pools all phases, six data regions and seven ingredients: the signal plus six backgrounds. With a reference model for the shape of the signal (Horiuchi and colleagues, 2009):
- best-fit flux: 3.6 (+1.6/−1.5) antineutrinos per square centimetre per second above 13.3 MeV, or 4.8 (+2.2/−2.0) events per year in SK;
- significance: 2.6 sigma;
- gadolinium phases alone (1,653.7 days): 2.2 sigma; pure-water phases alone (3,349.3 days): 1.4 sigma — gadolinium’s far better neutron tagging outweighs its shorter run;
- two other signal shapes give 2.7 and 2.6 sigma;
- the flux sits near the top of the 2.1 to 3.9 range the reference model predicts.
What does 2.6 sigma mean? If SK were recording background alone, with no supernova neutrinos at all, data like these would be unlikely: the authors disfavour that “nothing but background” hypothesis at a 99.5% confidence level. That is why they call it an indication — in their words, the first one for this signal — rather than an observation.
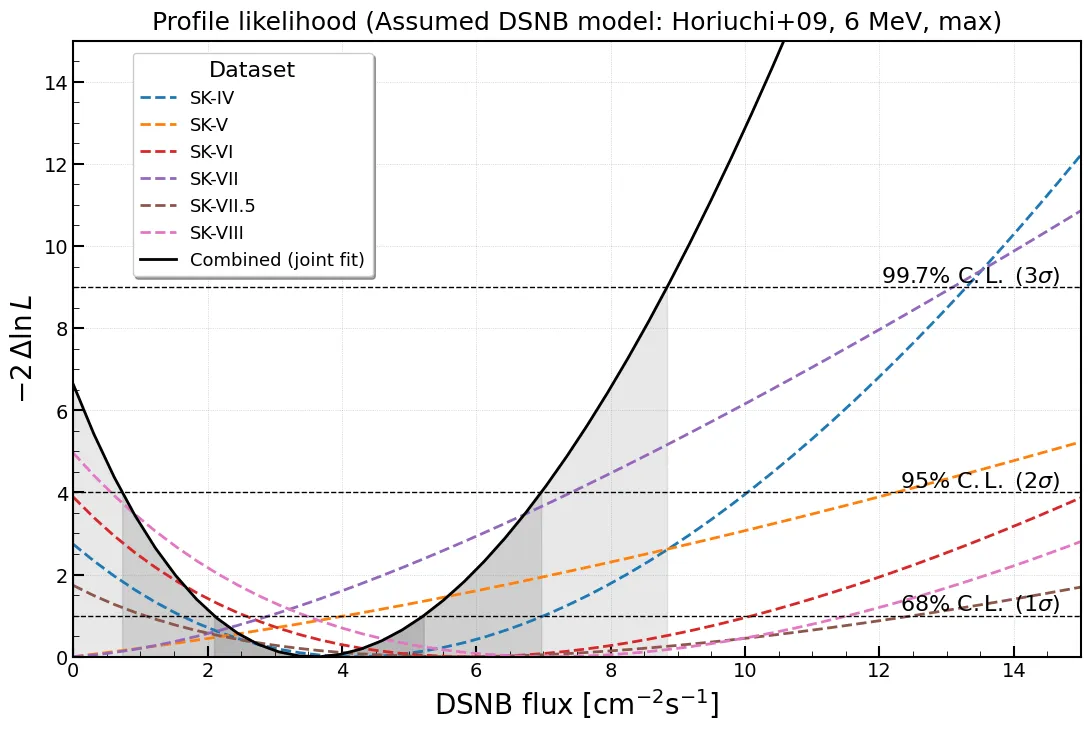
How badly each flux fits the data (black: all phases; dashed: each phase alone): the curve bottoms out near 3.6, and at zero flux it rises between the 2-sigma and 3-sigma lines. — Figure 5, Abe et al. (2026), arXiv:2610.35619.
A cruder count, a weaker tension
A cross-check that assumes no shape for the signal — simply counting candidates with one tagged neutron between 13.3 and 31.3 MeV against the expected background — gives a tension of only 1.8 sigma. And above 17.3 MeV, the new flux, 1.8 (+0.8/−0.7) per square centimetre per second, agrees within its uncertainties with the 1.4 (+1.5/−1.2) found by the collaboration’s previous search on gadolinium data alone.