A NEUTRINO DETECTOR UNDER THE ICE COULD TAKE THE STRATOSPHERE'S TEMPERATURE
The stratosphere above Antarctica is changing on the scale of decades, as the ozone layer recovers and the circulation around the pole shifts. But the interior of the continent is one of the least instrumented places in the atmosphere. Weather reconstructions — “reanalyses” that blend scattered observations with a weather model — fill the gap, and they are only as good as the observations that feed them. An independent measurement would be valuable.
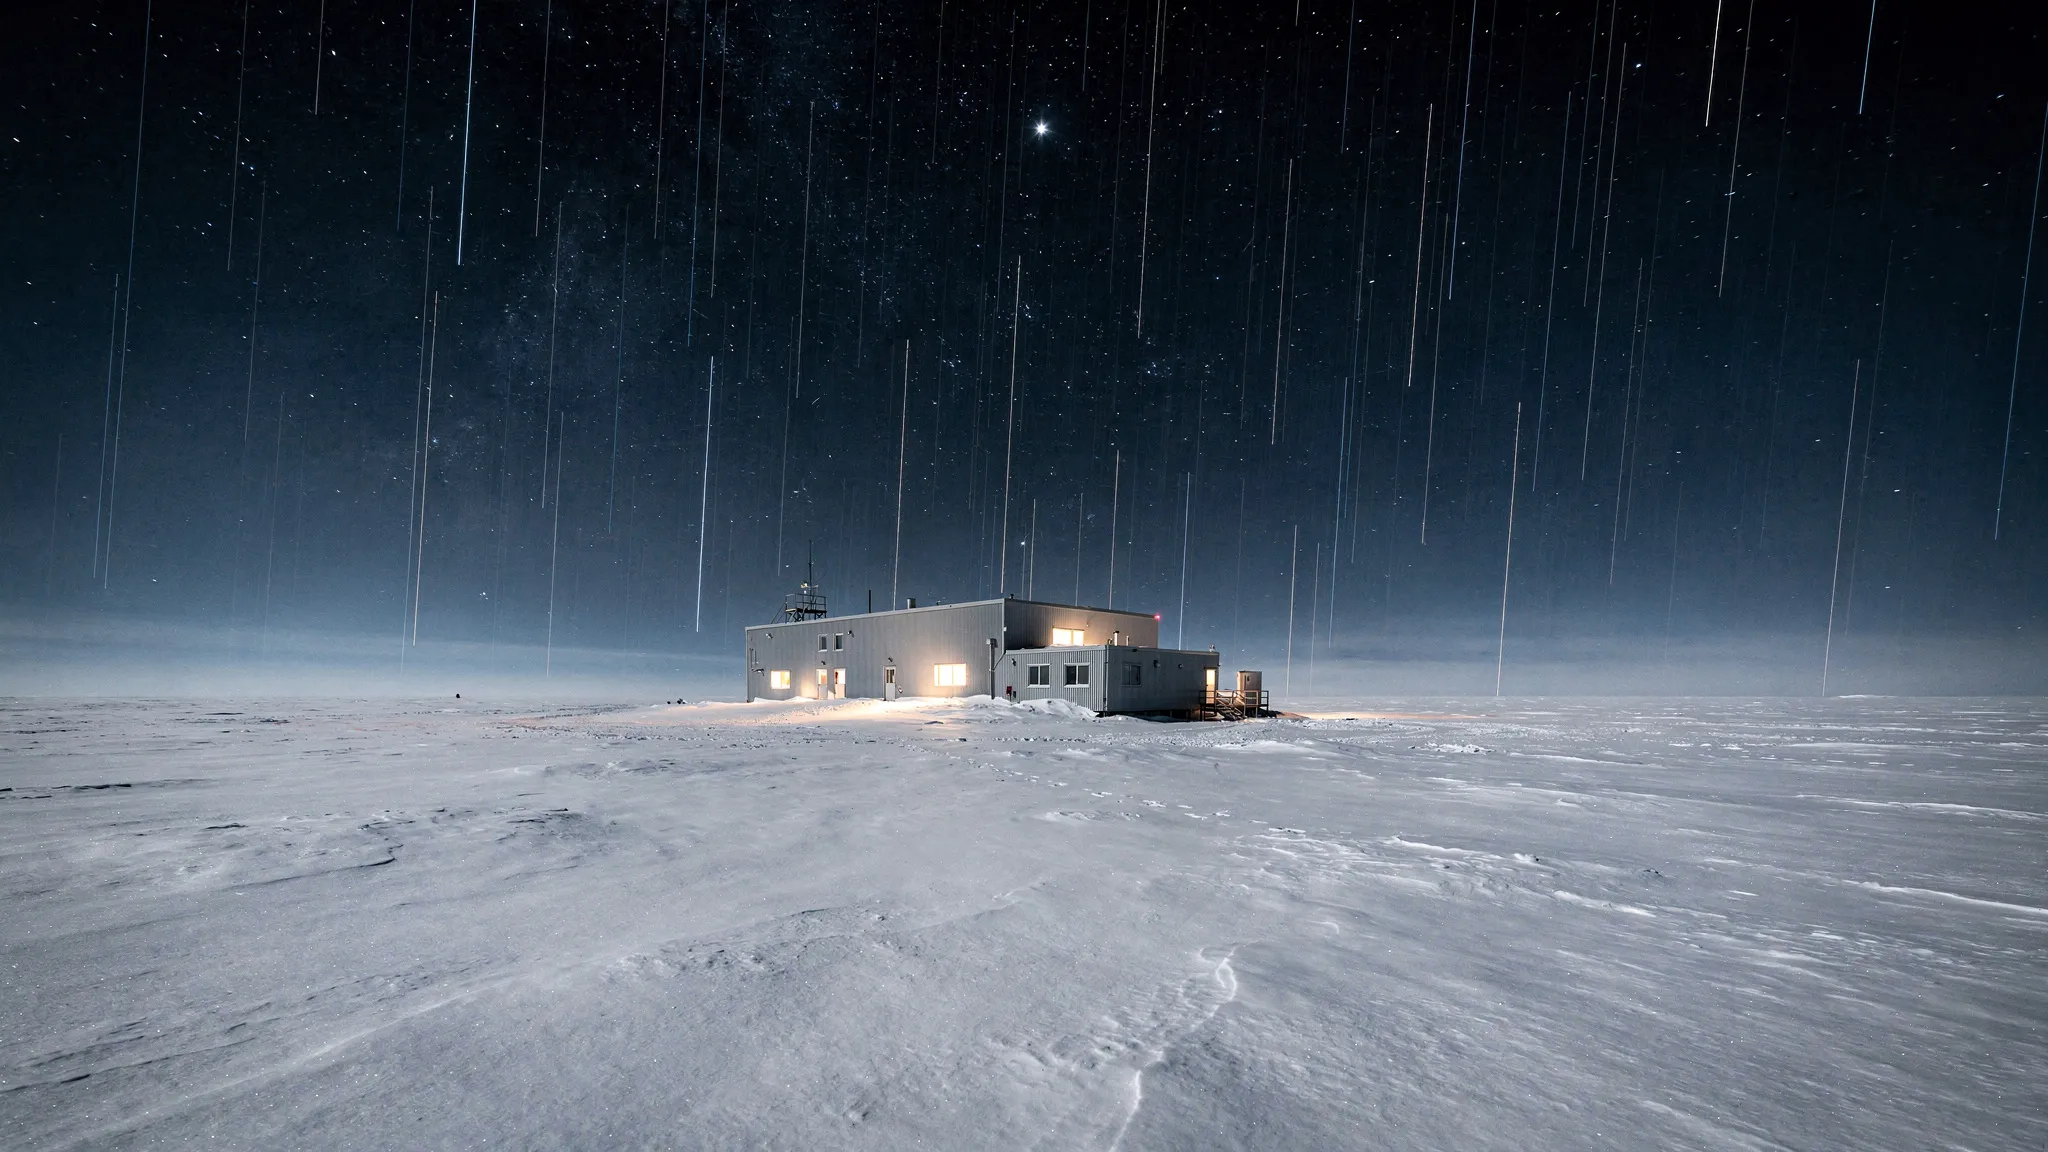
One may already exist, by accident. IceCube is a neutrino observatory a cubic kilometre in size, with more than 5,000 light sensors buried between 1,450 and 2,450 metres deep in the ice at the South Pole. Besides its rare neutrinos, it records a far larger stream of muons — particles created when cosmic rays strike the upper atmosphere — at about 2,150 per second. For neutrino hunters they are background noise. But their number depends on the temperature of the air overhead.
Why muons feel the temperature
Cosmic rays hitting the atmosphere create short-lived particles called pions and kaons. Each one either decays into a muon or collides with an air molecule first. When the stratosphere warms, it thins out at a given altitude, so more of them decay into muons before colliding. IceCube’s rate therefore follows the seasons, rising and falling by about 8% around its average, and a 1% change in the “effective temperature” — a weighted average of the air column — shifts the muon rate by about 0.75%.
The weighting matters. About 94% of it comes from air above roughly 8 kilometres, peaking near 14 kilometres: IceCube’s muons mostly report on the stratosphere, as a single average over the column.
A feasibility test
Tanvi Krishnan and Carlos Argüelles, at Harvard University, and Gabriela Barenboim, at the University of Valencia, asked whether the same signal could track slow, decade-long trends. They did not use IceCube’s actual rate: they built simulated muon counts from public temperature reconstructions at the South Pole, from cosmic-ray and solar records, and from IceCube’s published sensitivity and rate.
Their calculation reproduces the seasonal swing measured by IceCube. A long-term trend has a different vertical shape — the stratosphere cools while the lower air warms — and the response to it turns out about 3% stronger than the seasonal one, a small correction. The Sun barely interferes: the cosmic rays behind IceCube’s muons are so energetic, in the trillions of electronvolts, that solar activity changes their flux by only 0.01 to 0.13%.
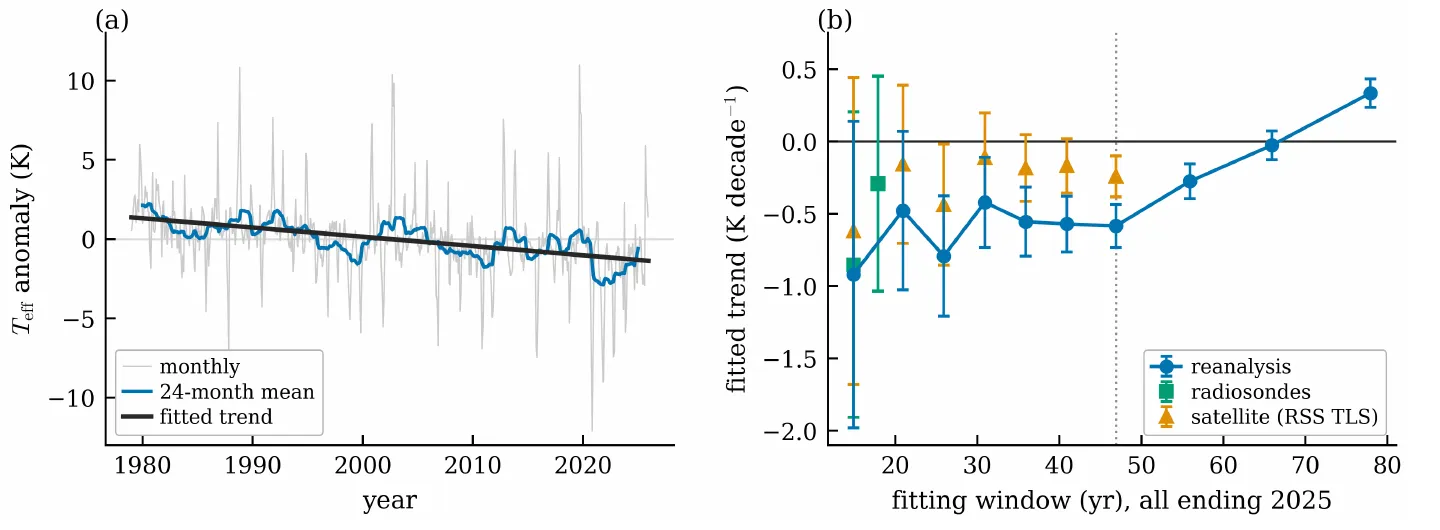
(a) The effective temperature above the South Pole since 1979, cooling by 0.58 kelvin per decade on average. (b) The fitted trend depends on the length of the window and can even change sign, so any measurement must state its window. — Figure 3, Krishnan, Barenboim & Argüelles (2026), arXiv:2611.00918.
Stability is everything
With some 2,000 muons a second, the random scatter of the count itself is negligible. The real limit is the stability of the detector. If the muon count drifted slowly for any instrumental reason, that drift would be read as a change in temperature:
a drift of 1% per decade in the rate mimics a trend of 2.8 kelvin (2.8 °C) per decade.
Since 2011, the reconstructions show the stratosphere cooling by about 0.9 kelvin per decade. To avoid faking a trend that large, the detector’s rate must stay stable to about 0.3% per decade. Unlike random noise, such a drift does not average out with more years of data.
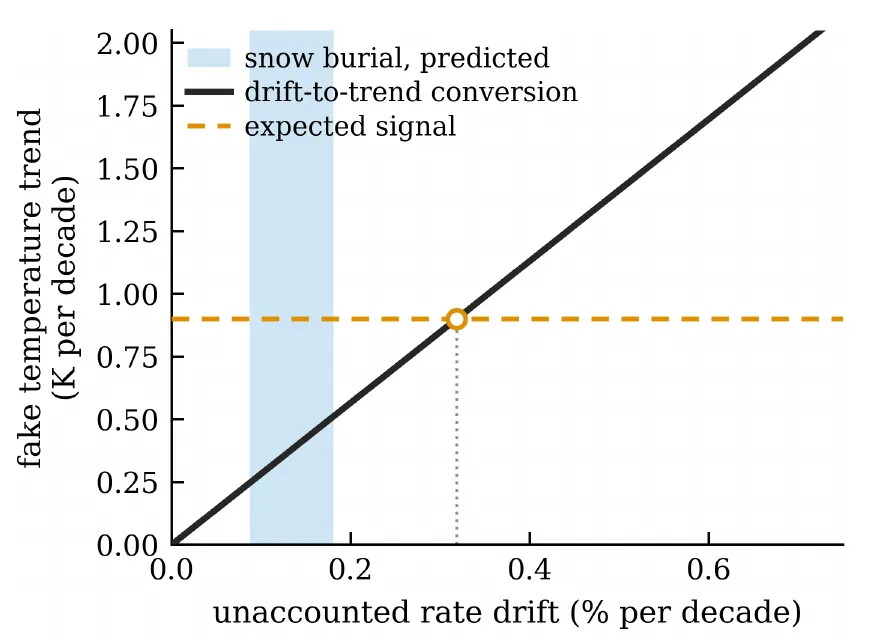
Converting an unaccounted drift of the muon rate into a fake temperature trend: the expected signal (dashed) is matched by a drift of about 0.3% per decade. The blue band is the drift predicted from snow piling up above the detector. — Figure 4, Krishnan, Barenboim & Argüelles (2026), arXiv:2611.00918.
Even the weather on the surface plays a part. Snow accumulates at the South Pole at about 8 centimetres of water equivalent a year — the depth of water it would make once melted — slowly deepening the ice above IceCube. A thicker shield stops more muons: the authors predict a drop of 0.09 to 0.18% per decade, equivalent to 0.24 to 0.51 kelvin per decade of fake cooling — the same sign as the real trend, a quarter to a half of its size. Because it can be predicted, it can be built into the analysis.
How long to wait
The polar stratosphere is noisy: monthly temperatures jump around by 2.5 kelvin. With 14 years of data — the 2011–2025 record — the statistical sensitivity, the smallest trend the record could confirm at 95% confidence despite those swings, is 1.6 kelvin per decade, not enough to confirm the 0.9-kelvin cooling. It reaches 0.93 after 20 years, 0.51 after 30 and 0.33 after 40. The cooling of the IceCube era could be confirmed with a record of roughly 22 years, eight more than the 14 since 2011 — if the detector holds steady.
The next step is to run the method on IceCube’s real rate, with its own instrumental quirks. The authors note it would work for any deep detector whose rock or ice cover is known.