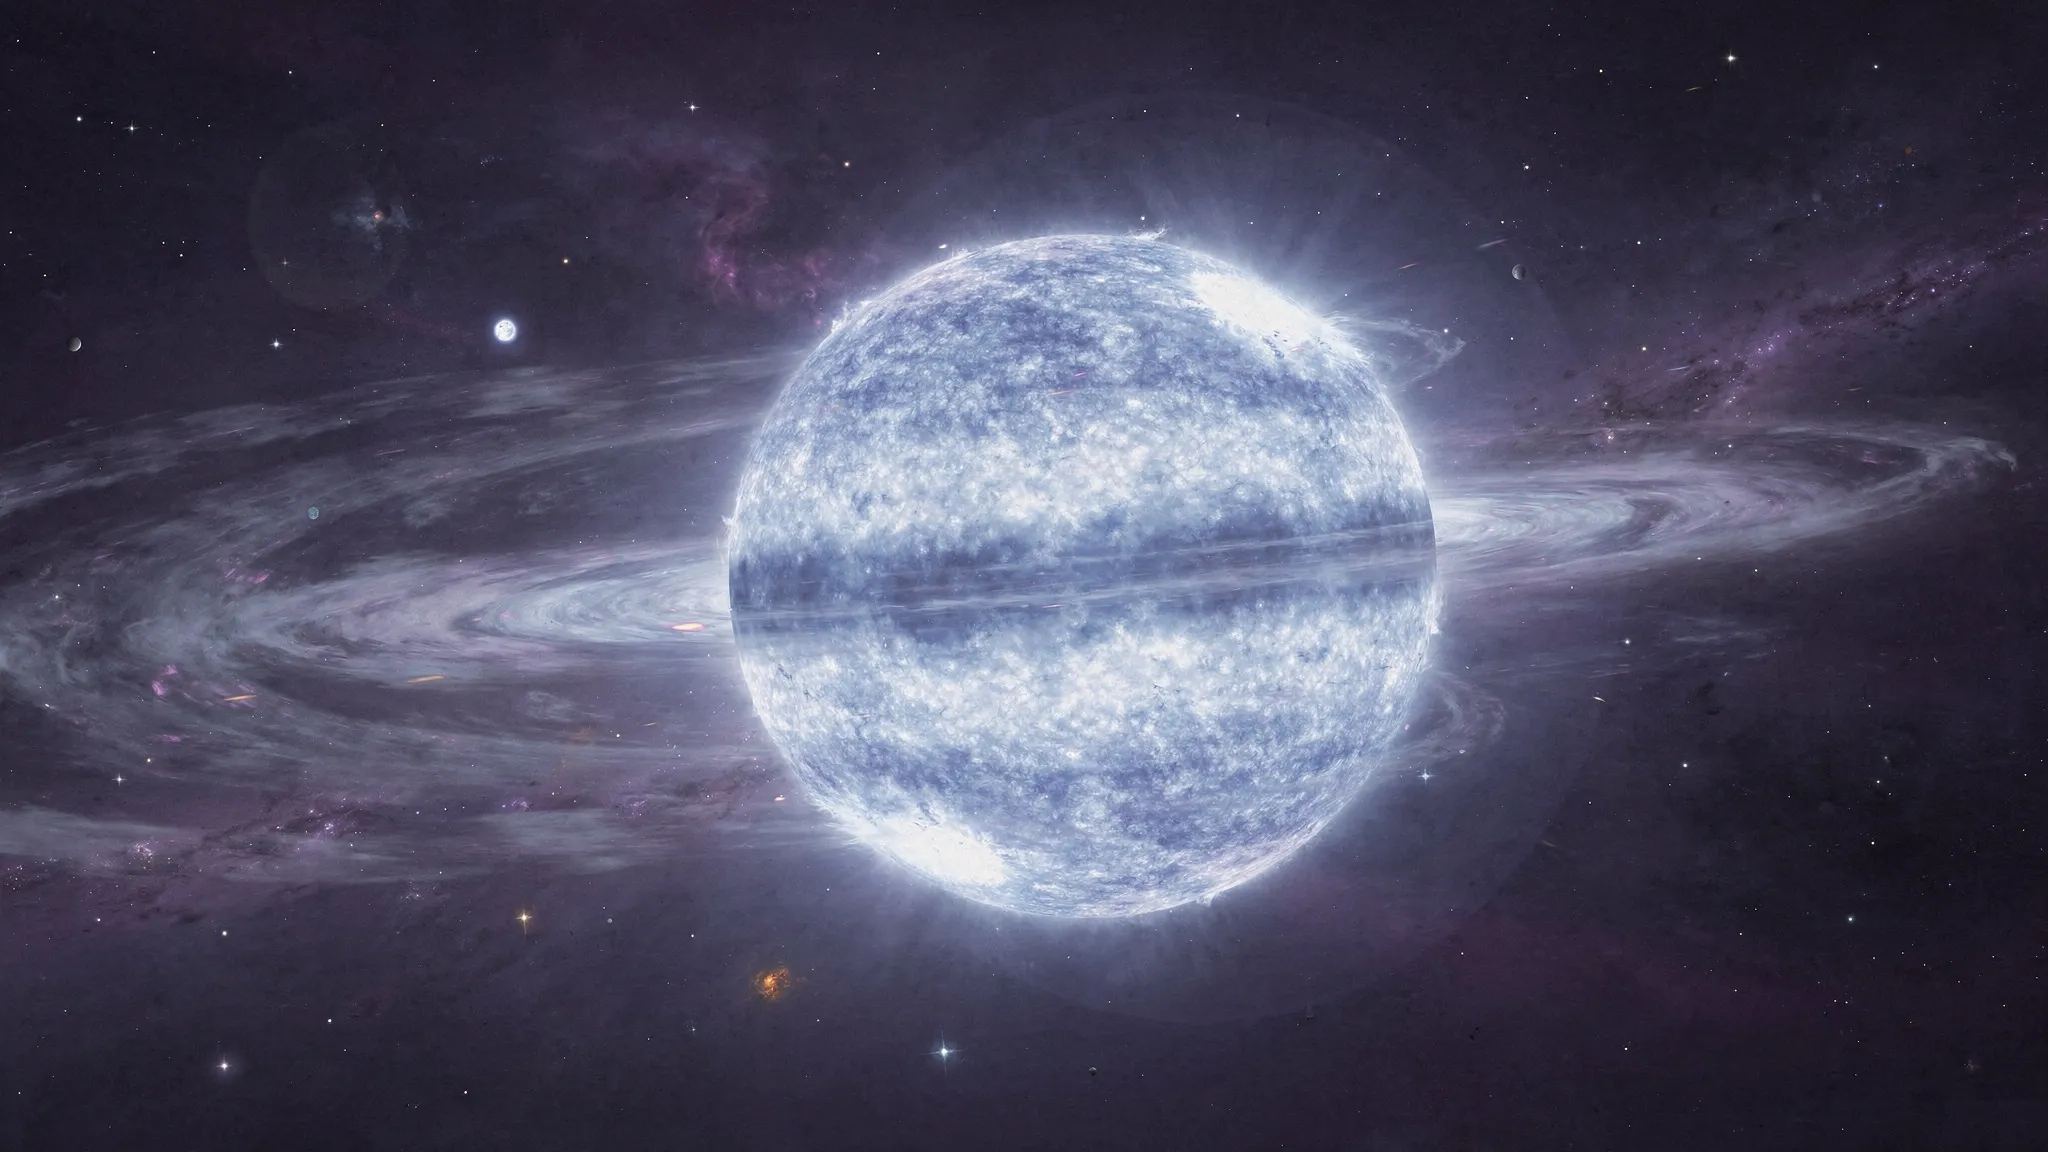
A MASSIVE STAR SPINNING SO FAST IT HAS FLATTENED
Spin a star fast enough and it changes shape. The outward push of rotation stretches its equator, and the star becomes oblate, like a squashed ball. Its surface no longer looks the same everywhere: the poles, where gravity is stronger, are hotter and brighter, while the stretched equator is cooler and dimmer — an effect called gravity darkening.
Massive stars can be spun up when they exchange matter with a companion in a binary. If the pair is later disrupted, the star may be thrown out at high speed, becoming a runaway. LAMOST J040643.69+542347.8, a massive O-type star (the hottest and most massive class of stars) observed by the LAMOST spectroscopic survey, is both: a runaway, and an extreme rotator.
Measuring a spin from a smeared line
A star’s spin shows up in its spectrum. One side of the star moves towards us and the other away, so each absorption line is smeared by the Doppler effect: the faster the spin, the wider the line. What this measures is v sin i — the speed of the equator projected along our line of sight, which depends on how the spin axis is tilted towards us.
A 2020 study fitted this star’s spectrum with spherical models and a classic rotation smear, and found about 543 kilometres per second. But a spherical model misses something. The fastest-moving regions, at the equator, are also the coolest and faintest, so they contribute little light, and the lines can look narrower than the true spin would make them.
Michel Curé, of the University of Valparaíso in Chile, and colleagues in Chile, Brazil and China re-analysed the same spectrum with a code called ZPEKTR, which treats the star as a squashed, spinning surface. It cuts that surface into small pieces, each with its own radius, gravity, temperature and speed, assigns each a local spectrum, and adds them all up as seen from Earth. They compared 223,560 models with the observed helium lines.
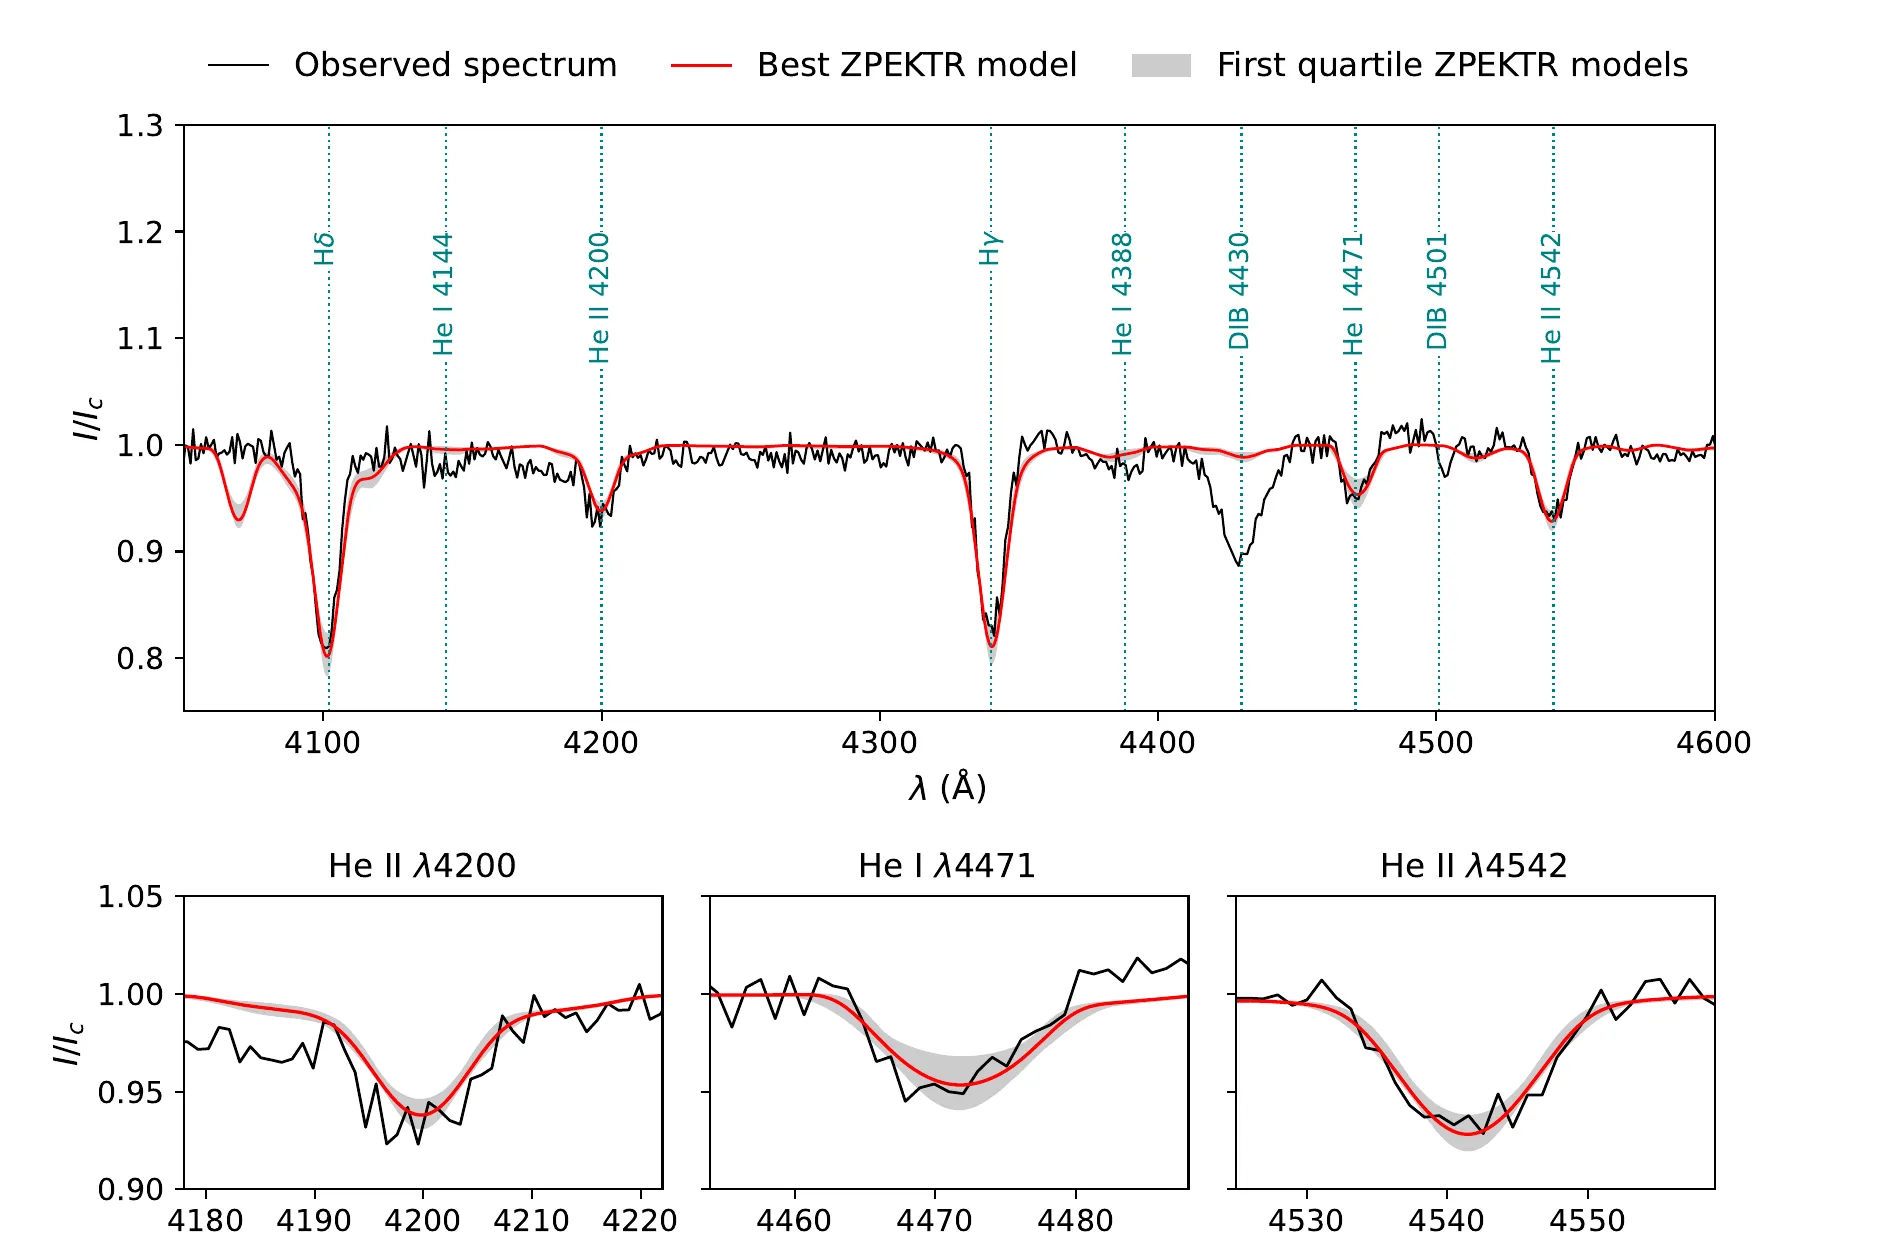
The observed LAMOST spectrum (black) and the best squashed, gravity-darkened model (red), with three helium lines used in the fit shown close up. — Figure 1, Curé et al. (2026), arXiv:2611.05760.
The numbers
- Projected equatorial speed: 587 ± 73 kilometres per second — higher than the earlier value, but statistically consistent with it.
- Shape: the equatorial radius is 1.25 times the polar radius.
- Temperature: about 41,000 kelvin at the poles, about 34,000 at the equator.
- The spin axis is tilted about 65 degrees to our line of sight.
- Spin rate: 93% of the critical angular speed at which the equator would stop being held by gravity.
The model also gives a mass of about 55 Suns, but the authors note that this value, like the two radii, sits at the edge of their model grid, so its uncertainty is underestimated.
How close to breakup?
That 93% sounds like a star on the brink. The authors warn against reading it that way. In the model they use, the spin rate climbs towards its critical value very quickly as the star flattens, while the balance of forces at the equator changes slowly. At the equator of this star, the outward push of rotation is only half the pull of gravity. The reason: the push of rotation grows, and gravity weakens, the farther the equator sits from the centre; at breakup it would bulge out much farther than it does here. At true breakup, the two would be equal, and the equator would be 1.5 times wider than the poles, against 1.25 here.
Their advice: quote all three measures together — the spin rate relative to critical, the equatorial speed relative to critical (77% here) and the balance of forces at the equator — rather than calling a star “near-critical” without saying which one is meant. By all of them, this one is exceptional: strongly flattened, gravity-darkened, but not yet at the edge.
What remains open
The spectrum has low resolution, and several parameters touch the limits of the model grid. The authors did not refit the star with a spherical model on exactly the same grid, so they cannot say whether, or by how much, the old approach underestimated the spin; nor did they test a different gravity-darkening law. Two lines that show emission, possibly from a lopsided wind or surrounding gas, are left out of the model. High-resolution spectra taken at several dates would help — and interferometry could one day show which way the star’s spin axis points on the sky.