WILD BIRDS AS A WARNING LIGHT FOR BIRD FLU IN MAMMALS
Since 2020, the highly pathogenic avian influenza virus A(H5N1), of the lineage known as clade 2.3.4.4b, has circulated widely in wild birds, spread between continents and infected a growing range of mammals, on land and at sea. In the United States, it even spread among dairy cattle, showing that a virus of avian origin can circulate in a population of mammals managed by humans. Each infected mammal is another opportunity for the virus to adapt.
Mammals can catch it by hunting or scavenging infected birds, or through contaminated water and shared habitats. But surveillance cannot test every animal everywhere. Could detections in wild birds tell teams where and when to look for infected mammals?
Two surveillance streams, side by side
H. O. Fatoyinbo, of the Department of Mathematical Sciences at Auckland University of Technology in New Zealand, analysed the public records of the US Department of Agriculture’s animal health service, from April 2022 to July 2026: 18,523 detections in wild birds, from 248 species, and 815 in mammals, from 56 species. In both streams, the median delay between sample collection and detection was 15 days.
The two series behave differently. Bird detections rise every autumn and winter and fall in summer. Mammal detections are more episodic, with the largest national peak in May 2024. In most combinations of one state and one month — 89.9% of them — no mammal was recorded at all, but of the 268 that had at least one, 80% also had a bird detection the same month.
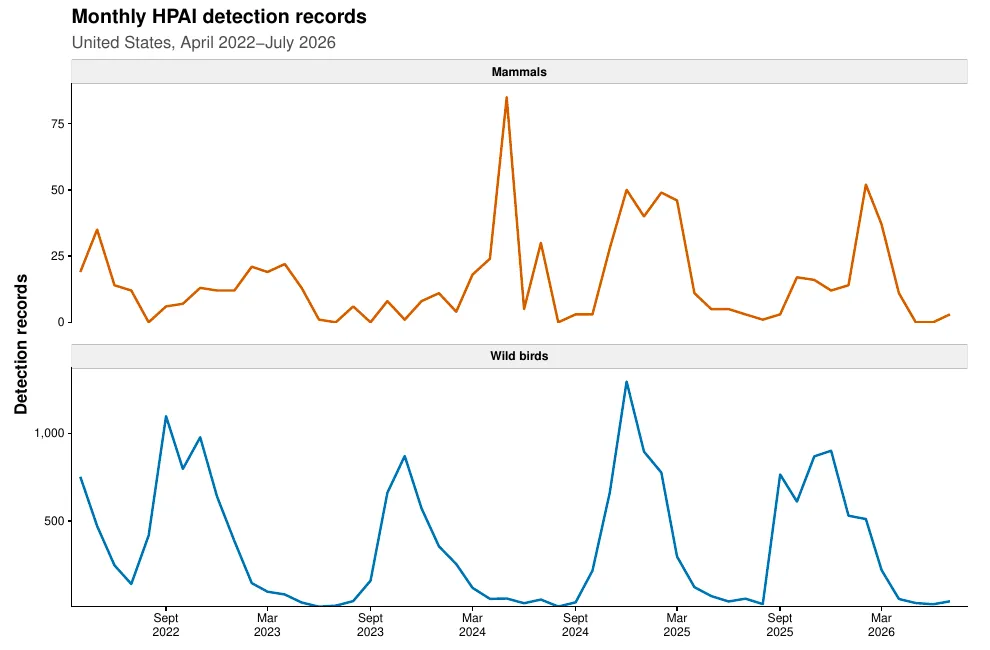
Monthly detection records of highly pathogenic avian influenza in mammals (top) and wild birds (bottom), United States, April 2022–July 2026. These are positive surveillance records, not infection rates. — Figure 1, Fatoyinbo (2026), arXiv:2611.12005.
A local, short-term signal
A raw coincidence could just reflect the seasons or busy local outbreaks. So the model accounts for the yearly cycle, for the previous month’s mammal detections and for lasting differences between states, and then asks what wild birds add.
The answer: in the same state, doubling the number of bird detections goes with 57.9% more expected mammal detections the same month, and a doubling the month before with 15.9% more. Bird activity two or three months earlier adds nothing. Neither do birds in neighbouring states, once a state’s own birds are counted: the useful information is local. Mammal detections also follow themselves strongly from one month to the next.
The result survives a robustness check. Many records were exact repeats, which could be duplicates or genuinely distinct animals; removing them gives 59.7% and 13.3%.
Better forecasts, not yet a forecasting tool
The decisive test was prediction. The study held out February to July 2026 and asked the model to predict each month’s mammal detections from the previous month. Adding wild birds cut the average error by 23.8% and by 27.9% the root-mean-square error, a measure that weighs large misses more heavily. But the model still predicted 167 detections where 101 were observed, and its uncertainty ranges were too wide.
The paper insists on what this does not show: the association does not establish direct bird-to-mammal transmission, nor a probability that the virus jumps from birds to a mammal (spillover). Birds and mammals may simply be sampled more at the same time and place, during the same investigations. The records also lack the number of animals tested and the surveillance effort behind each positive.
What it supports is a practical use: high local bird activity could become one ingredient of a trigger for collecting carcasses, testing susceptible mammals or alerting wildlife rehabilitators and veterinary laboratories — once the model has been validated prospectively, over several epidemic seasons.