EARTH'S RESTLESS SKY, SEEN FROM THE MOON
The ionosphere, the electrically charged upper layer of Earth’s atmosphere, is never perfectly smooth. Patches of more or fewer electrons bend the radio waves that cross it, and as these waves travel on, the distortions turn into rapid changes in their strength. Navigation receivers see this as flickering, called scintillation.
Until now, such flickering has been measured close to Earth: by receivers on the ground, below the ionosphere, and by satellites in low orbit that watch navigation signals graze the edge of the atmosphere.
A receiver on the Moon
The Lunar GNSS Receiver Experiment, LuGRE, travelled to the Moon aboard Firefly’s Blue Ghost-1 lander. From 3 to 16 March 2025, it recorded nearly 93 hours of signals from the GPS and Galileo navigation satellites, on two frequencies each, once per second.
Rong Yang, of Shanghai Jiao Tong University, and colleagues in Turin, Rome and Hong Kong picked out the moments when those signals had skimmed past the Earth on their way to the Moon, between 50 and 1,000 kilometres above the surface. The receiver itself sat roughly 356,000 to 398,000 kilometres away.
Why distance changes the picture
How strongly an irregularity makes a signal flicker depends on its size compared with a scale set by the wavelength and the distances involved, the Fresnel zone — irregularities around its size are the ones that make signals flicker most. For receivers near Earth, this zone has a radius of a few hundred metres at the ionosphere. For a receiver on the Moon, it grows to more than 2 kilometres and then stops growing, reaching a limit fixed by the wavelength and the distance to the transmitting satellite. Structures a few kilometres wide that barely disturb near-Earth links can therefore leave a clear mark at lunar distance.
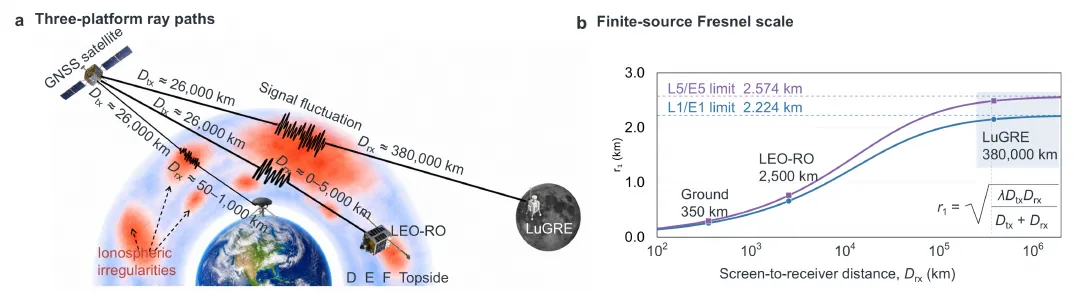
Three ways of listening through the ionosphere: from the ground, from low orbit and from the Moon (a); the Fresnel radius grows with distance to the receiver and levels off above 2 kilometres at lunar distance (b). — Figure 1, Yang et al. (2026), arXiv:2611.21062.
Flickering over the poles
Along paths crossing both polar regions, the signals faded sharply, sometimes by more than 10 decibels (the decibel is the unit used for changes in signal strength). The team counted a one-minute window as a disturbance when the gap between the signal’s highs and lows over that minute reached 1.5 decibels, three times the background noise measured on paths far from the atmosphere.
Over the poles, 30% of the valid windows met that criterion: 207 out of 680. Over the equator, 4.1%; at mid-latitudes, 2.6%. In all, 81% of the disturbed windows came from the polar regions. The result held when the threshold was lowered.
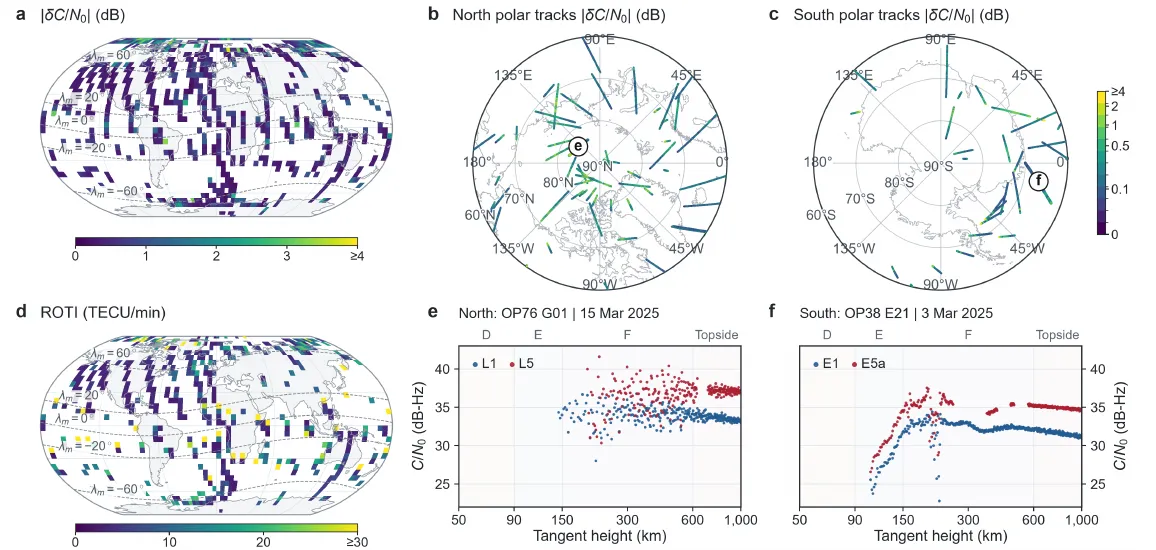
Signal flicker seen from the Moon, mapped where each path came closest to Earth (a, b, c), the corresponding electron-content index (d), and two strongly disturbed passes over the north and south polar regions (e, f). — Figure 2, Yang et al. (2026), arXiv:2611.21062.
The checks ruled out simpler causes. The fluctuations also appeared during calm periods of geomagnetic activity, the satellites’ antennas were not at the edge of their beams, and the paths stayed clear of the solid Earth. Radar echoes and ground measurements recorded at the same time showed structured plasma — the electrified gas of the ionosphere — in the same polar sectors.
The reverse of the view from below
The comparison with 182 ground stations and four missions of low-orbit satellites that catch navigation signals grazing the atmosphere (a technique called radio occultation), at the same hours, is striking. Near Earth, the largest fluctuations appear at the equator. From the Moon, they appear at the poles: the threshold of the strongest 5% of flickers was 1.20 decibels over the poles, against 0.71 at the equator and 0.57 at mid-latitudes. The lunar receiver also probed higher, into the upper ionosphere, beyond the roughly 300 kilometres covered by the satellites in low orbit.
The direction of the sweep mattered. As the satellites and the Moon move, the point where a signal grazes the ionosphere slides along. Over the poles, the flicker was about three times stronger when that point slid along the direction of Earth’s magnetic field than when it slid across it. Irregularities in the ionosphere are often stretched along the field lines, which could explain this sensitivity.
Mornings only
The authors warn against reading too much into the latitude contrast. Almost all the equatorial windows seen from the Moon fell between 6 and 11 a.m. local time. Equatorial plasma bubbles and the irregularities that come with them usually develop after sunset — and were barely sampled.
Programmes such as NASA’s Artemis, ESA’s Moonlight and China’s Chang’e missions are widening the opportunities to work on the Moon. Repeated over seasons and solar conditions, measurements like these could turn the Moon into a long-term observatory of Earth’s ionosphere — and help design receivers that cope with its fades.