THE ASTEROID THAT DART REPAVED
When NASA’s DART spacecraft struck Dimorphos on 26 September 2022, it changed the orbit of this small asteroid around its larger partner, Didymos. Telescopes and the small LICIACube probe watched a plume of debris fly off. The momentum transferred and the shape of that plume suggest that Dimorphos is a rubble pile: a loose heap of boulders and gravel, barely held together.
Yet different interiors can match those observations. A team from Belgium and Romania asked where the debris went next, and what that means for the European Space Agency’s Hera mission, which arrives at the pair in late 2026 to complete the DART experiment.
Eight million particles and a 580-kilogram ball
The researchers used a smoothed particle hydrodynamics (SPH) code, which cuts a body into millions of small particles that carry mass and push on one another — about 8 million per run.
- DART became a 580-kilogram aluminium sphere hitting at 6.14 km/s, along its reconstructed trajectory.
- Dimorphos was an ellipsoid of about 177 × 151 × 116 metres: angular boulders 2.2 to 18 metres across, packed in gravel that is 45% empty space.
- A second version added a 64-metre boulder at the centre. The two bodies weigh 3.53 and 3.79 billion kilograms.
- The pull of Didymos, 1.2 km away, and the rotation of the pair were included. Each run covered six hours, about half of Dimorphos’s orbit around Didymos.
Thirteen percent up, twelve percent back down
- The impact launched about 13% of Dimorphos’s mass, mostly at a few centimetres per second.
- About 12% of the asteroid’s mass landed back on it. About 1% was captured by Didymos or stayed bound to the pair; only about 0.2% escaped the system.
- Around 80% of the returning material landed within 30 minutes.
Instead of a bowl-shaped crater, the impact left a flat-floored depression. The returning debris covered the entire surface, but unevenly: more than 8 metres deep around the rim of the depression, only a few tens of centimetres near the antipode, the point opposite the impact. In such weak gravity, the pull of Didymos and the rotation of the pair bend the paths of slow debris; without these effects, earlier simulations gave an even blanket.
Large boulders punched through the falling debris, stayed exposed and shielded the ground behind them. The central boulder barely changed the overall pattern: away from the rim and from boulders, the debris layers of the two models generally differ in thickness by less than a metre.
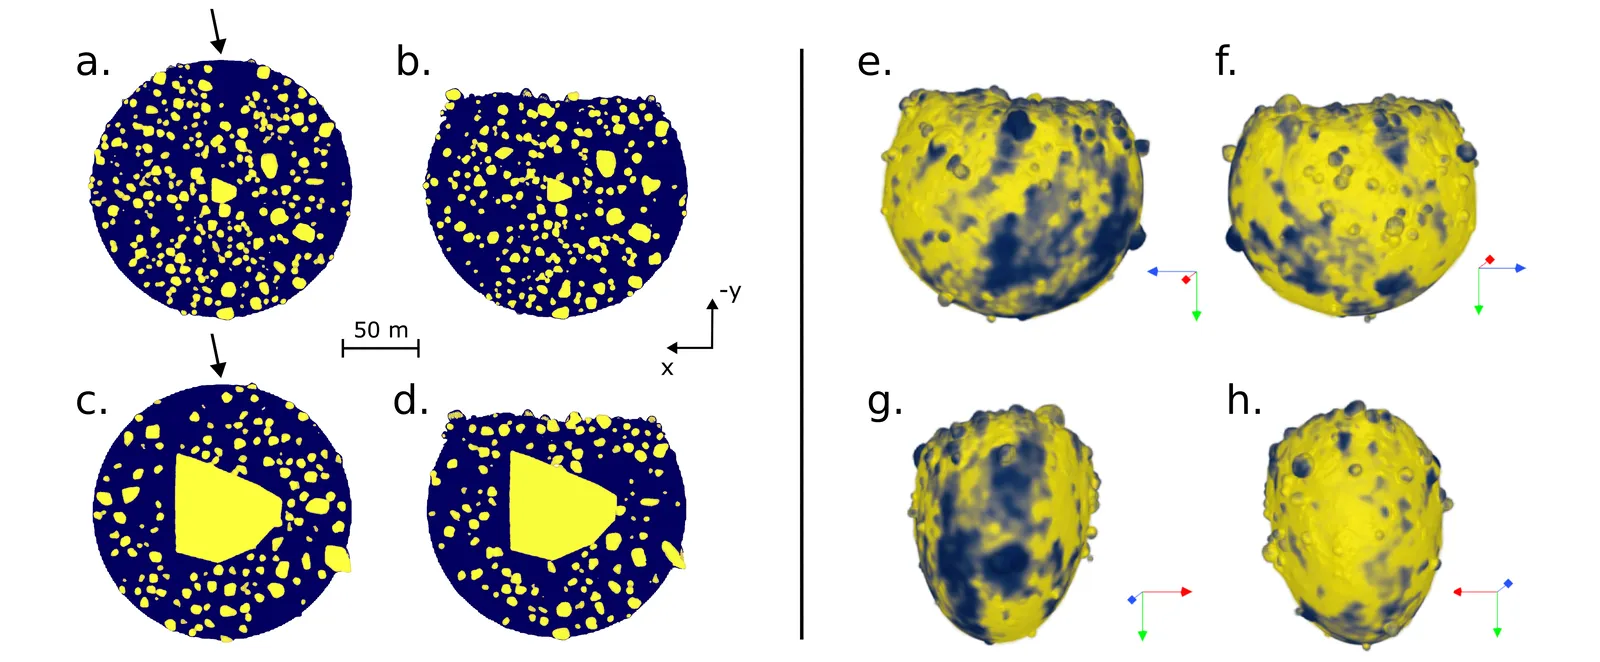 Left: cross-sections of the two simulated asteroids before and after the impact (bottom row: with a central boulder). Right: the debris blanket of the uniform model from four sides (yellow: fallen debris; blue: less than 20 cm). — Figure 1, Raducan et al. (2026), arXiv:2610.35718.
Gravity with new bumps
Before the impact, the shape of the asteroid set the pattern of its surface gravity. Afterwards, the big picture barely moves, but local changes appear, reaching about 0.004 millimetres per second squared (gravity measured as the speed a dropped object gains each second) — roughly 10% of the local gravity before the impact. The new bumps come mostly from metre-sized boulders: thrown out more slowly than the gravel, they tend to stay on the asteroid, and the impact digs up buried ones too.
And the hidden 64-metre boulder? It makes gravity stronger everywhere, simply because the body is heavier, but it leaves no telltale pattern — except in one place. Inside the depression, digging brought the surface about 20 metres closer to it. Compared with a body of the same shape and uniform density (a Bouguer anomaly), gravity there is about 10% higher — a different 10% from the one above, which compared the asteroid before and after the impact — a signal absent from the uniform model.
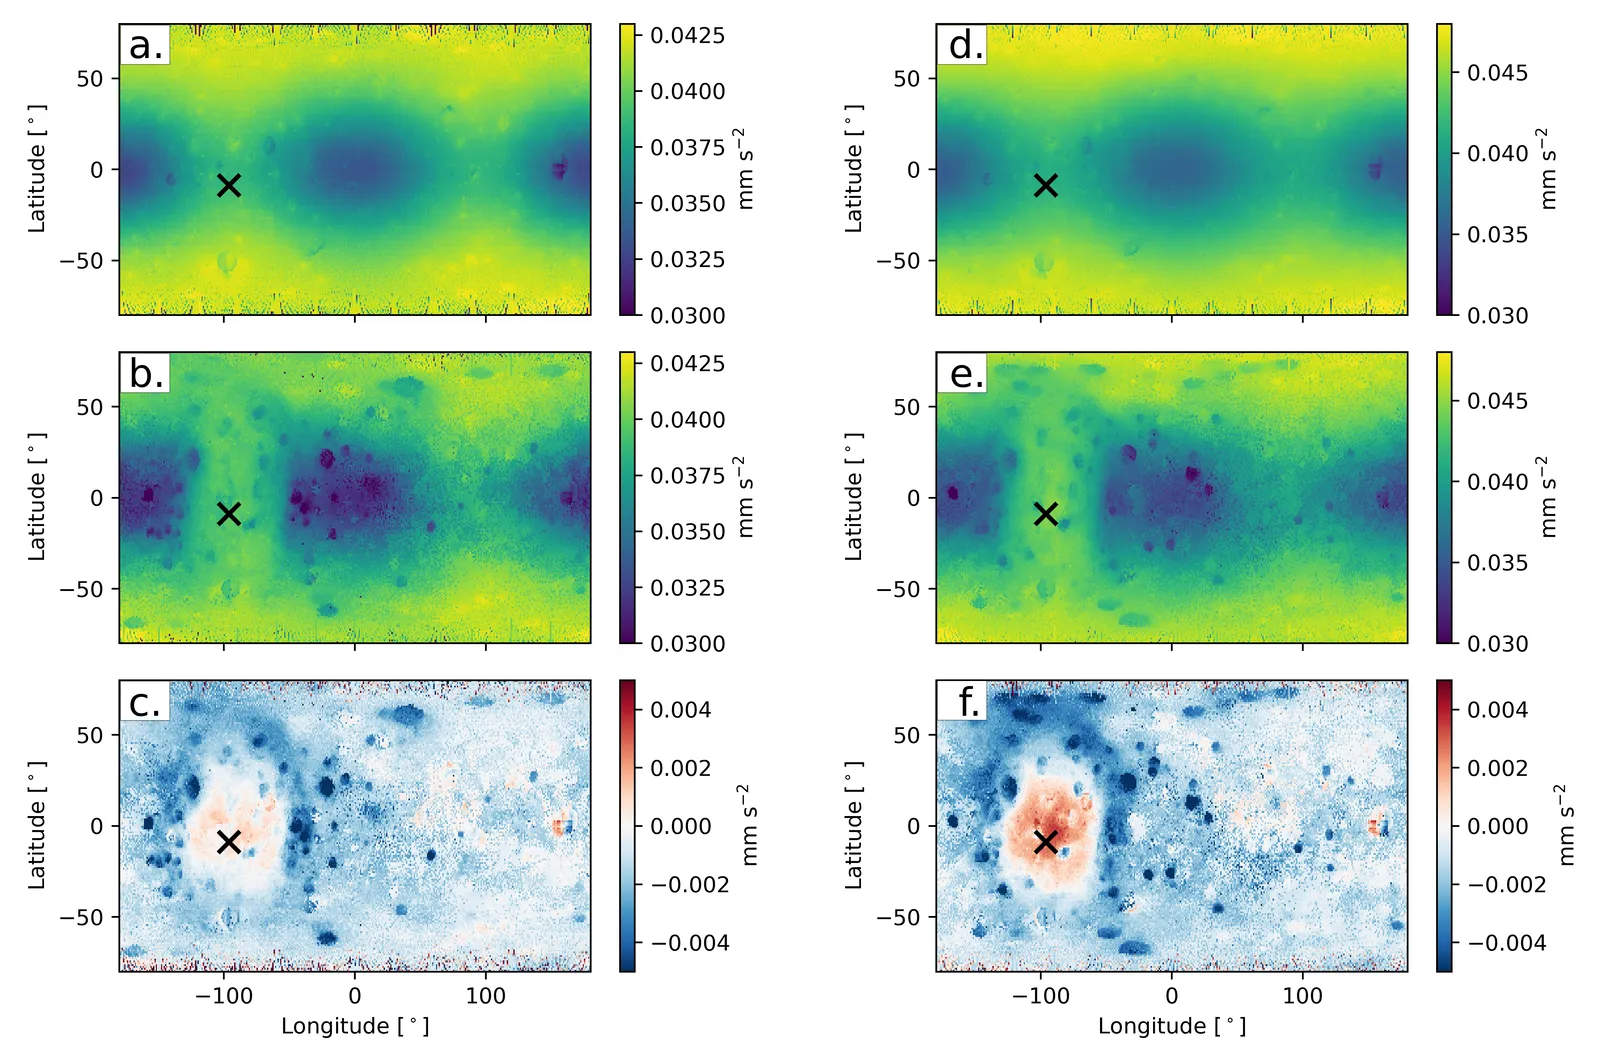 Simulated surface gravity before (top) and six hours after the impact (middle), and the change (bottom), without (left) and with (right) a central boulder; the cross marks the impact site. — Figure 3, Raducan et al. (2026), arXiv:2610.35718.
What Hera’s instruments will meet
Hera will measure the shape and mass of the pair. Its small CubeSat, Juventas, will probe Dimorphos with a low-frequency radar, JuRa, and, after landing, measure local gravity with the GRASS gravimeter. The HyperScout-H imager will record the surface in narrow bands of light between 0.65 and 0.95 micrometres.
- Colours. Reflected light only probes the top few micrometres (thousandths of a millimetre) of a surface, and even the thinnest predicted deposits are thicker: in HyperScout-H’s colours, most of Dimorphos may look freshly resurfaced, showing DART’s debris rather than the surface that was there before. The old surface most likely survives near the antipode and beside sheltering boulders.
- Gravity. The predicted changes are about a hundred times larger than what GRASS can detect. Nearby boulders and uneven debris can shift both the strength and the direction of the pull it measures.
- Depth. The deep interior is easiest to sense inside the depression. But one spot may not represent the whole asteroid, and gravity alone cannot separate shallow boulders from deep ones: the radar, which looks inside, has to fill that gap.
Six hours, two extremes
These are two extreme versions of Dimorphos, not the real one; both are heavier than a recent estimate drawn from its motion, about 2.7 billion kilograms. The thicknesses assume the fallen gravel is 20% less dense than before; if it is fluffier, the layers are thicker than reported. And when the simulation stops at six hours, the last 6% of the debris is still circling the pair, on paths that may take days to weeks to end.