LIGHT THAT TURNS IN CIRCLES MAKES GRAPHENE TOPOLOGICAL
Graphene’s electrons live on two families of sites in its lattice, called sublattices A and B. At rest, each electron is shared equally between them. Theory predicts that light whose electric field turns in circles tips that balance — one way in the upper energy band, the other way in the lower one — and that reversing the rotation reverses the tilt. A team led from Bordeaux has now detected the trace of that tilt and, the authors argue, a state of matter long predicted for graphene.
A gap, and a shape
Electrons in a solid can only take energies grouped into bands; a band gap is a range of energies with no allowed state between two bands. In graphene, the upper and lower bands are two cones touching at their tips, the Dirac points: no gap, so graphene is a semimetal.
In 2009, Oka and Aoki predicted that circularly polarized light would open a gap there. Light is an oscillating electric field. In linearly polarized light, the field swings back and forth along a line; in circularly polarized light, it turns in a circle, one way (σ+) or the other (σ−) — its helicity. A swing looks the same played backwards; a rotation does not. Circular light thus breaks what physicists call time-reversal symmetry, which gives graphene’s electrons a light-induced “mass” and opens the gap. In the theory, that mass grows with the square of the light’s electric field and falls with the cube of its frequency.
The result would be a Floquet topological insulator, “Floquet” meaning states shaped by a periodic drive. But a gap alone proves nothing, the authors stress: gaps open for many reasons unrelated to topology. What is topological is the geometry of the electron waves. The way an electron is shared between A and B is its pseudospin. It varies with the electron’s momentum, and under circular light this pattern comes with a quantity called Berry curvature, which measures how much the electron’s wave twists as its momentum changes. Added up over all momenta, it gives the Chern number: a whole number, 0 for an ordinary insulator and 1 here, in the theory. That whole number is what makes the state “topological”.
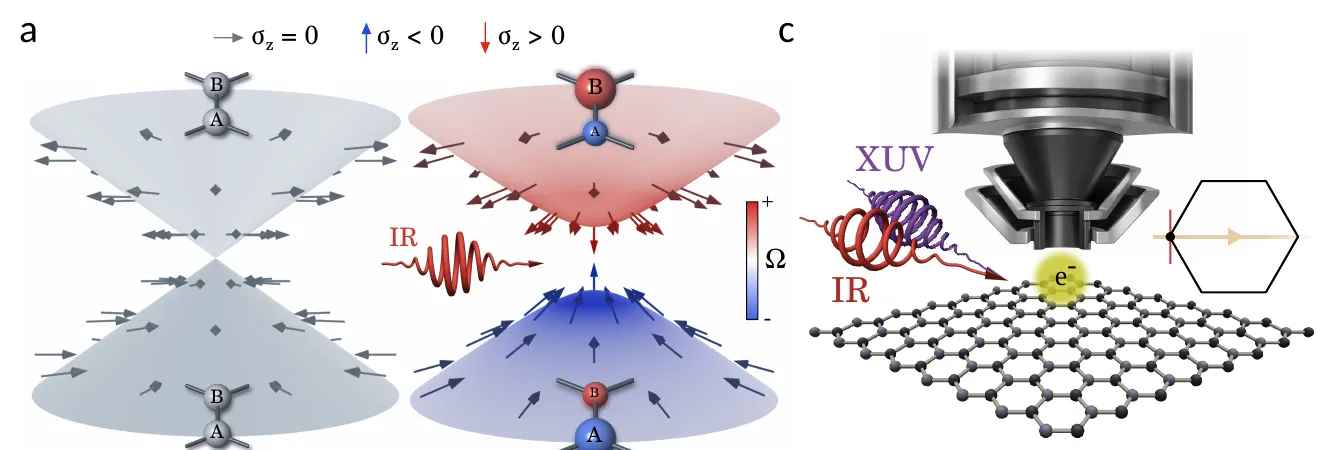
Left: graphene’s two energy cones at rest, touching at their tips, with electrons shared equally between sublattices A and B. Centre: under circularly polarized infrared light (IR), a gap opens, each band favours a different sublattice (arrows and spheres), and Berry curvature appears (red and blue). Right: the experiment, an infrared pump and an extreme-ultraviolet probe (XUV) striking graphene under the microscope. — Figure 1a, c, Fragkos et al. (2026), arXiv:2610.39695.
Why graphene resisted
In graphene, electrons scatter off each other and off lattice vibrations unusually fast, raising doubts that light-shaped states could survive. Electrical and optical measurements had detected a light-induced “anomalous Hall” response — a sideways current that appears without any magnet — which theory links to Berry curvature, but they average over all energies and momenta: they cannot tell topology from electrons excited unevenly by the light. Experiments that imaged graphene’s light-reshaped bands in 2025 and 2026 used linear polarization, which cannot open this gap.
Two flashes at once
Sotirios Fragkos, Samuel Beaulieu and colleagues at CELIA (University of Bordeaux, CNRS, CEA), with theorists Ann Chantal Goutier and Michael Schüler (PSI in Villigen and University of Fribourg, Switzerland) and teams in Göttingen, Aarhus and Marburg, used time- and angle-resolved photoemission. An infrared pump pulse drives graphene grown on silicon carbide (SiC), at room temperature. It lasts 135 femtoseconds — millionths of a billionth of a second — and carries photons of 1.2 electronvolts, the energy of each particle of light. Its fluence, the energy delivered per unit area, is 3.5 millijoules per square centimetre (mJ/cm²), equivalent to an electric field of about 4,000 kilovolts per centimetre. At the same moment, an extreme-ultraviolet flash of 21.6 electronvolts knocks electrons out, and a time-of-flight momentum microscope records their energy and direction: a map of the bands.
The probe’s polarization keeps cycling; the difference between the signals of its two circular states is the circular dichroism. Under a circular pump, its main light-induced part is proportional to the A/B imbalance: it reads which sublattice electrons favour.
The sign that follows the light
A linearly polarized pump left the dichroism as in unpumped graphene. A circular pump added a feature near the Dirac point: negative for σ+, positive for σ−.
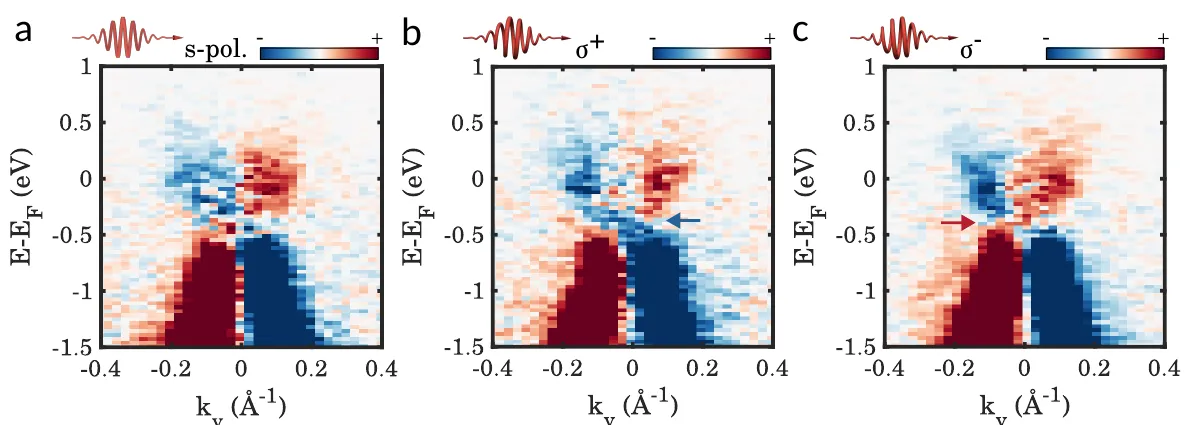
Measured circular dichroism (red positive, blue negative) versus energy (vertical) and momentum (horizontal), with the infrared pump linearly polarized (a), or circularly polarized one way (b, σ+) or the other (c, σ−). Only the circular pumps add a feature near the Dirac point (arrows), blue for σ+, red for σ−. — Figure 2a–c, Fragkos et al. (2026), arXiv:2610.39695.
Subtracting one map from the other removes everything that does not depend on the pump’s rotation. What remains, the double-helicity dichroism, is positive above the Dirac energy (the energy of the Dirac point) and negative below, as expected from opposite pseudospin in the two bands. First-principles calculations that include the substrate reproduce the maps and the sign change.
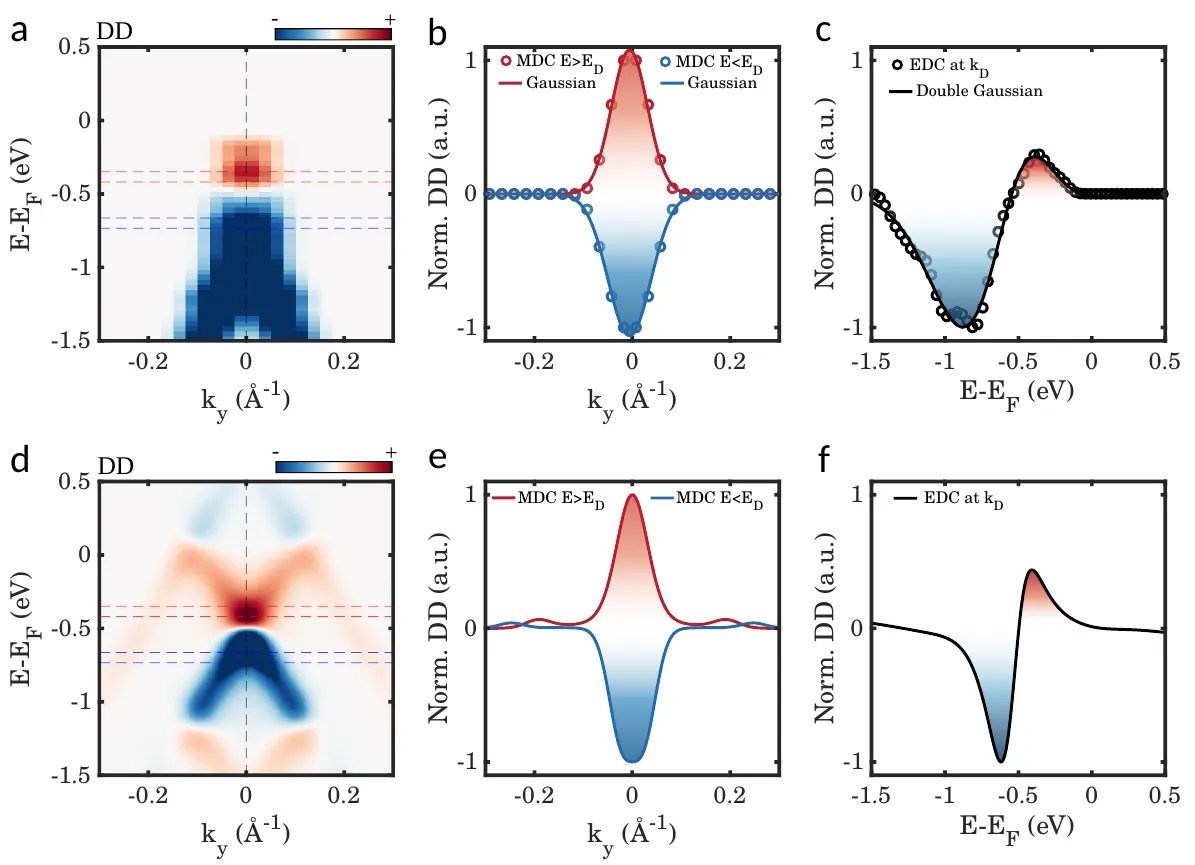
Double-helicity dichroism, the difference between the two circular pumps: measured (top) and calculated (bottom). Maps (a, d) and profiles (b, c, e, f) show a red positive signal above the Dirac energy and a blue negative one below. — Figure 3, Fragkos et al. (2026), arXiv:2610.39695.
At a lower fluence of 1.6 mJ/cm², the σ+ and σ− maps looked alike near the Dirac point: with a mass growing as the square of the field, a weaker drive pushes the effect below detection.
A tilt that outlasts the gap
The gap itself was not seen. A dip at the Dirac point resembles one, but it is far stronger with one probe polarization than another. The authors attribute it mainly to photoemission matrix elements — how efficiently the probe pulls electrons out of each band — and cannot rule out a small gap below their resolution. In their calculations, at the experiment’s field strength, the gap stays below a tenth of an electronvolt.
Away from the Dirac point, Berry curvature fades as 1/k³, k being the distance in momentum from the point, while pseudospin fades only as 1/k. The pseudospin spreads further along the bands, so the dichroism survives where scattering blurs a small gap.
Simulations rule out other culprits. Linear light of the same in-plane strength leaves practically no double-helicity dichroism, so the slanted 65° angle at which the light arrives cannot produce it alone. An ordinary substrate gap of 240 millielectronvolts would leave a wide blank region in the signal, absent from the data. A model keeping only the light-induced topological term matches the full simulation with a correlation of 0.985 (1 would be a perfect match) near the Dirac point.
Topology for the length of a pulse
The measurements cover only the moment the two pulses overlap; what follows is not shown. The Chern number comes from theory, and the matrix-element model was adjusted to the measurements themselves. Since the pump’s helicity sets the signs of the mass and of the Berry curvature, the authors see a route to writing, switching and erasing topological states on femtosecond timescales. For now, the light’s direction of rotation decides one measured thing: whether a signal near graphene’s Dirac point comes out negative or positive.