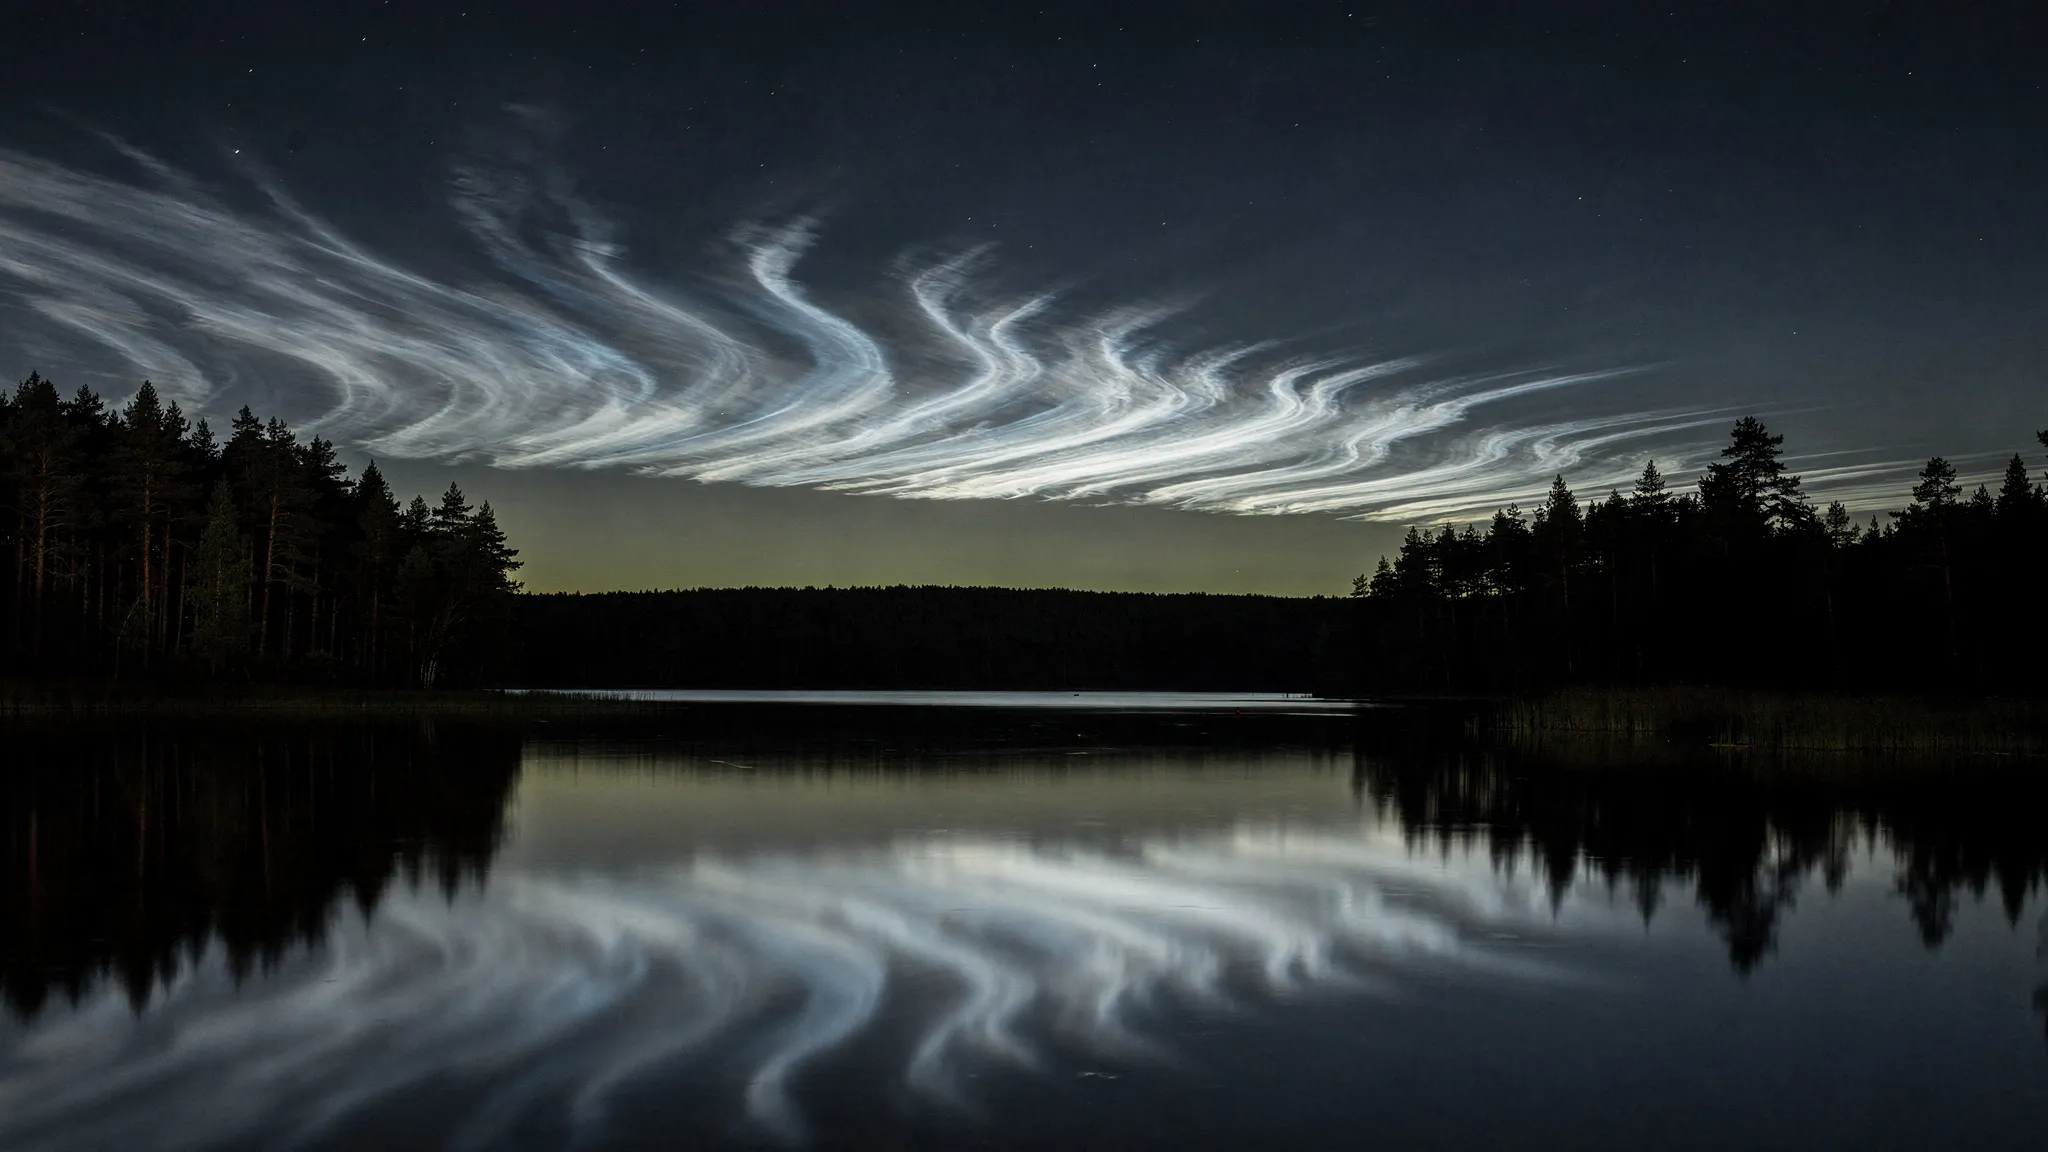
EARTH'S HIGHEST CLOUDS ARE SINKING
On summer nights, long after sunset, thin clouds can shine brightly in the twilight sky. They were first described in 1885, after the great eruption of Krakatoa in 1883. Because they are still lit by the Sun when the ground is in darkness, they must float more than 80 km up. If they are made of water ice, as assumed since 1912, the air there must be colder than 150 kelvins (about −120 °C). These are noctilucent clouds, the highest clouds on Earth.
A canary in the upper air
They have long been suspected of carrying a climate signal. Rising carbon dioxide cools the stratosphere and the mesosphere, the layers beneath the clouds. Cooled layers contract: the upper atmosphere “shrinks”, and the clouds, perched on top, should slowly sink. A climate model of this region, LIMA/MIMAS, predicts exactly that — a descent that speeds up after 1960, 6.5 times faster than before, as carbon dioxide rises ever faster.
Testing it is hard. How often the clouds appear depends on the number of observers and the weather; their brightness was measured with uncalibrated instruments. Their altitude, however, has been measured since their discovery. Earlier reviews found no clear trend: the heights scatter naturally between 79 and 85 km, more than the expected drop.
Comparing like with like
Oleg Ugolnikov, of the Space Research Institute of the Russian Academy of Sciences, and colleagues in Moscow and Kaliningrad, first set strict rules. Modern lidars, which probe the sky with laser light, see tiny ice grains high in the cloud layer, while photographs see the largest grains at its bottom — up to 2 km lower. So only one technique counts: triangulation, photographing the same cloud from two or more places and working out its height from the shift in its position.
They also dropped imprecise surveys. The very first, in 1887, found 79 km, but its two observers were only 32.4 km apart and synchronised only to within minutes — while the clouds drift at up to 50 m/s — enough for errors above 10 km. The team keeps only sites at least 40 km apart with exact timing: O. Jesse around Berlin in 1890-1891, C. Störmer near Oslo in 1932-1934, then Stockholm, Estonia, Latvia and Scotland, up to 200 km between sites in 1986.
Twenty thousand new heights
Since 2020, about twenty cameras, most of them in the automatic Starvisor network, have watched the sky between 54 and 61 degrees north. They work in groups 50 to 200 km apart, taking up to four images a minute. Software cuts each cloud field into fragments, matches them between cameras, and computes their height and speed. The result: about 20,000 individual altitudes.
A second method checks them with the same images. As a cloud slips into Earth’s shadow, it first turns bluer, when its sunlight crosses the ozone layer, then redder, as it passes through the lower atmosphere. The timing of these colour changes gives its height. After a correction for the haze of fine particles in the stratosphere, both methods agree to within 0.18 km.
Untangling the clues
The height of these clouds also depends on the season, the time of night, lunar tides, latitude and solar activity. The team fitted all of these at once, measurement by measurement, from 1890 to 2026. Only two effects stand out: the season, with the lowest clouds around 10 July, a few weeks after the solstice, and the long-term trend.
That trend is measured as a fraction K of the model’s prediction: K = 1 means the model is right, K = 0 means no trend. The fit gives K = 0.52 ± 0.18 — a descent detected with more than 99.5% confidence, but half what the model predicts. Today, that means about 1.2 km per century.
A simple check confirms it. Before 2000, the average height of all measurements was 82.52 km; in the 2020s it is 81.83 km. The clouds sit 0.69 km lower, about half the drop the model expects since 1960.
The bottom falls, the top holds
One detail stands out. The upper edge of the clouds’ height range has barely moved, over the season or over the decades. The lower edge has dropped about twice as much as the average — close to the pace the model predicts.
The authors expect further triangulation to sharpen today’s average height, but the trend itself will stay limited by the small number and modest precision of the old measurements. The real gain, they write, will come once lidars, satellites and cameras have watched the clouds for long enough in the 21st century.