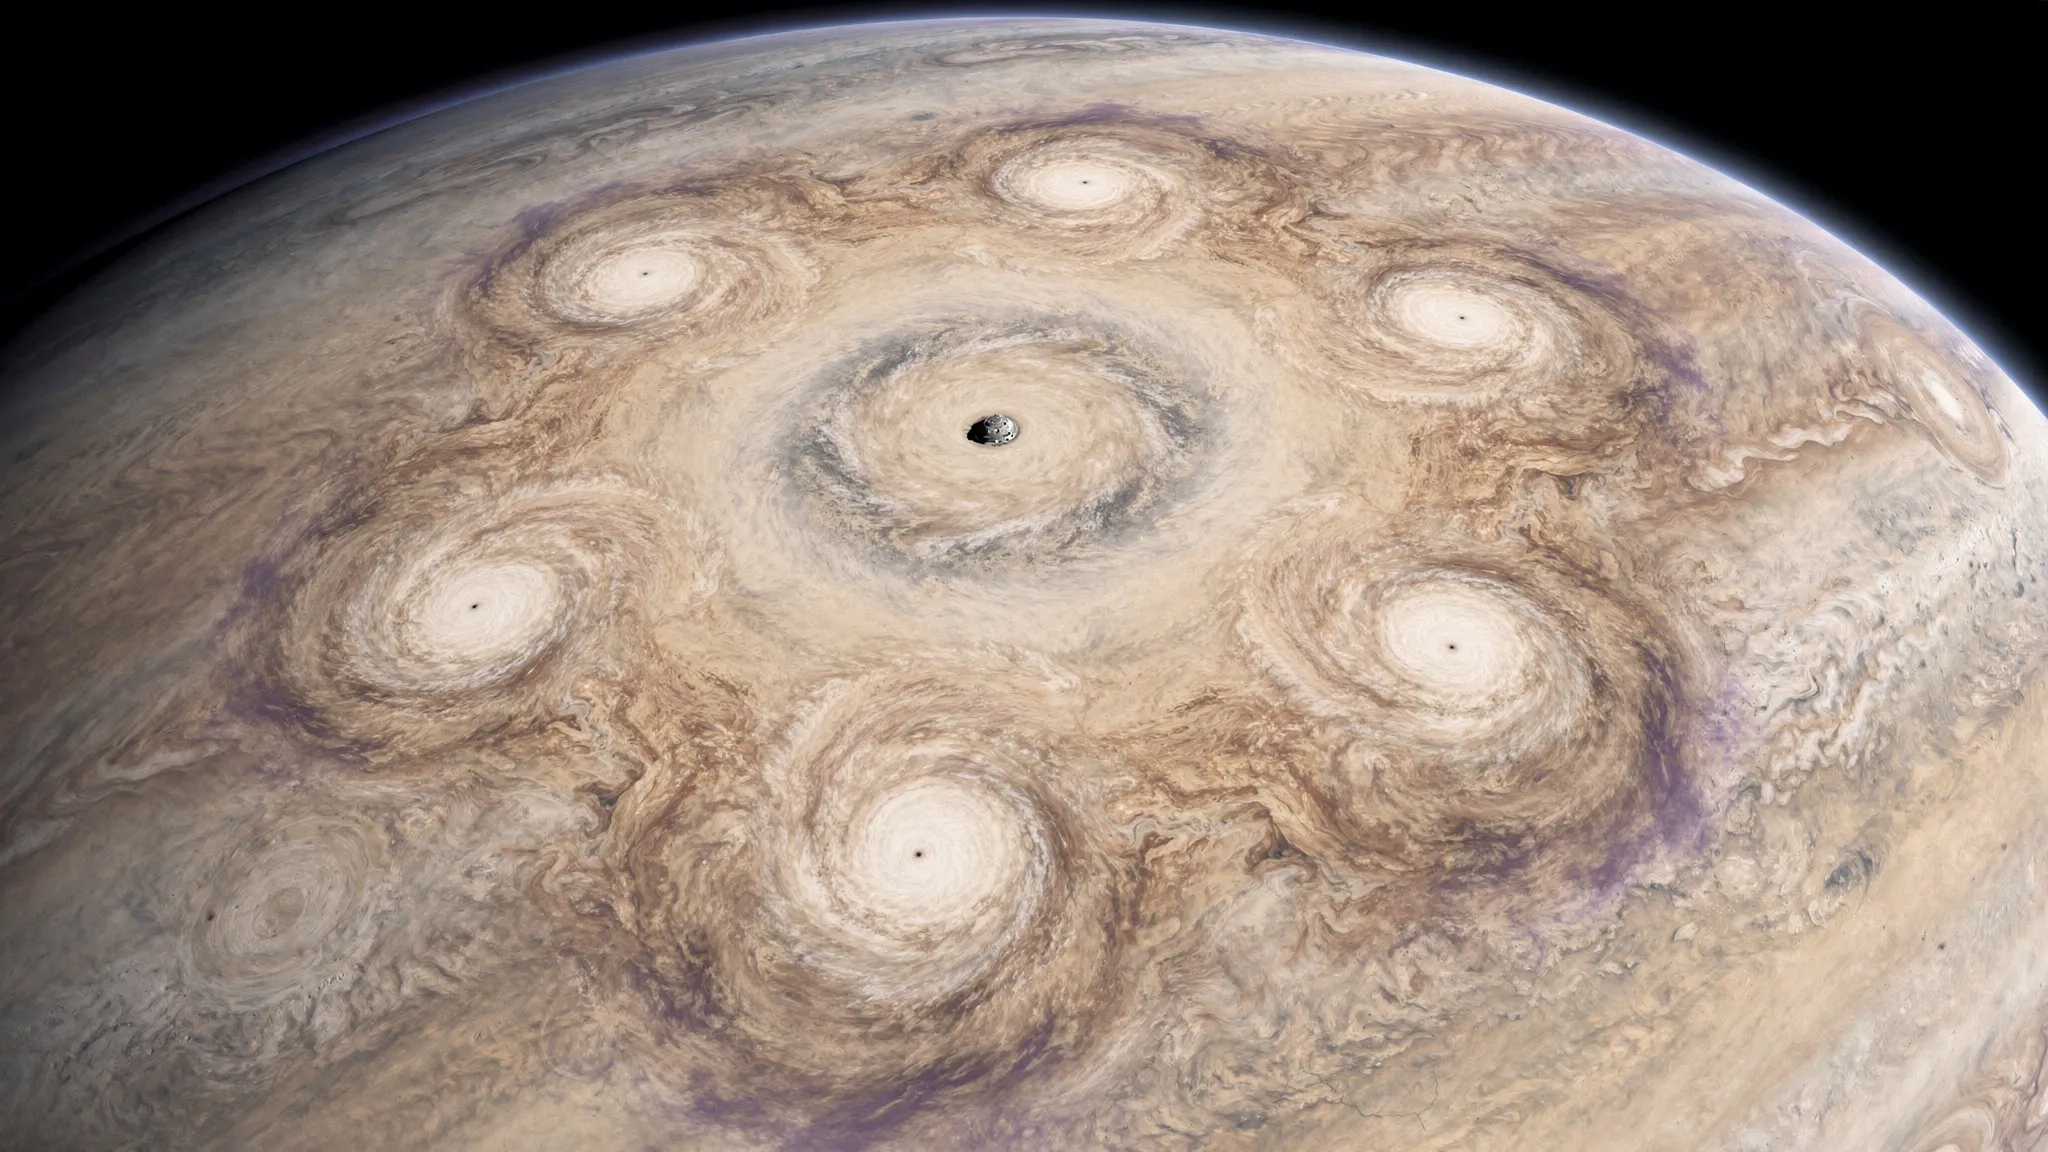
JUPITER'S POLAR CYCLONES ARE NOT ALL ALIKE
When NASA’s Juno spacecraft first looked down on Jupiter’s poles, it found something no one had seen: at each pole, a polygon of cyclones circling a central one. At the north pole, eight “circumpolar cyclones”, labelled C1 to C8, form an octagon around the north polar cyclone. It is markedly different from the passing polar vortices of the rocky planets, and from Saturn’s hexagonal polar vortex.
Models have tried to explain how such a lattice forms and stays stable, mostly by treating the vortices as thin, two-dimensional swirls. The only three-dimensional model that reproduces the polygon predicts that the polar vortices are some 20 to 35 kelvin colder than their surroundings. But no one knew how deep these cyclones go, or what lies beneath their cloud tops.
Listening beneath the clouds
Jiheng Hu, Cheng Li and colleagues at the University of Michigan, NASA’s Jet Propulsion Laboratory and other institutions turned to Juno’s Microwave Radiometer. It listens at six frequencies, from 600 megahertz to 22 gigahertz; each frequency comes from a different depth, down to about 300 kilometres below the cloud tops.
From its 51st close pass, on 16 May 2023, Juno’s orbit carried it ever closer to the north pole, less than 4,000 kilometres above the clouds. Over eleven flybys, until May 2024, the radiometer mapped the polar region. Because the eight cyclones barely moved — by less than 500 kilometres in a year — the passes could be combined into maps with pixels about 400 kilometres across. The two lowest frequencies, however, were swamped by emission from Jupiter’s auroras and had to be set aside.
Eight bright spots
In the maps, the eight cyclones stand out as discs 4,000 to 5,000 kilometres wide that shine brighter in microwaves than the surrounding atmosphere: up to 3 kelvin brighter near the ammonia clouds, and about 5 kelvin brighter around the level where water condenses. The contrast fades deeper down.
They fall into two groups. Cyclones C1, C3, C4, C5 and C7 are bright; C2, C6 and C8 are fainter. That matches what Juno’s camera shows: the first five look well-formed and “filled”, the other three more irregular.
Warm hearts, or missing ammonia?
Microwave brightness can mean two things. It can come from warmer gas, or from gas poorer in ammonia, which absorbs microwaves. The team computed both readings. As temperature, the five strong cyclones are 4 to 6 kelvin warmer than their surroundings, the three weak ones 1 to 2 kelvin. As composition, the strong ones have lost 40 to 100 parts per million of ammonia — about 10 to 25% of the deep value — and the weak ones 20 to 30. In both readings, the strong anomalies are confined above about 5 bar of pressure.
The two pictures are not exclusive. Air sinking in the core of a cyclone would bring down ammonia-poor gas from higher up and warm it by compression. Either way, the outer cyclones look like warm-core storms — the kind fed by heat released as vapour condenses, like Earth’s tropical cyclones and Saturn’s polar vortices. Why three of them are weaker despite their symmetric places in the octagon remains open; they may be at another stage of a convective life cycle.
The odd one in the middle
The real surprise is the central cyclone. In visible and infrared images, it is larger and cloudier than its neighbours. In microwaves, it is nearly indistinguishable from the surrounding polar atmosphere: about 1 kelvin colder, or 10 parts per million richer in ammonia, at the edge of the measurement noise. If the signal is thermal, it resembles a cold-core vortex, like Earth’s polar vortices.
Models had treated the polygon and its centre as products of the same self-organizing turbulence. The new data, the authors write, suggest that the central cyclone and its eight companions “may have distinct origins and operate under different dynamical regimes”.
How deep do they go?
The retrievals mostly sample the upper part of the storms, and the authors call the depths they find only loosely constrained. An alternative profile, with a reversed branch at depth, fits the data just as well and would let the strongest cyclones disturb the atmosphere down to at least about 60 bar. Settling this will require measurements the auroras have so far blocked, along with infrared spectra and radio occultations. The octagon has shown its upper storeys; its foundations are still out of sight.