Henüz çevrilmedi: İngilizce özgün metin.
HOW BIG ARE THE GRAINS AT THE BOTTOM OF THE MANTLE?
Far beneath Africa and the Pacific Ocean, at the base of the mantle, seismic waves slow down in two gigantic regions known as large low shear-velocity provinces (LLSVPs). They rise more than 1,000 km above the boundary with the core and cover nearly a quarter of its area. Whether they are hotter, chemically different, or both, is still debated. Seismic attenuation studies hint that they are made of coarse grains, surrounded by finer-grained mantle.
One candidate ingredient is davemaoite, calcium silicate in the perovskite structure, the third most abundant mineral of the lower mantle: about 10% of pyrolite, the standard model of mantle rock, and up to 25% of subducted basalt.
A thirty-percent riddle
Davemaoite is awkward to study. It cannot be brought back intact to the surface — it changes structure as it cools and turns glassy when pressure drops — so its elasticity must be measured at high pressure and temperature. And there, for decades, theory and experiment have disagreed: quantum calculations predict a shear modulus about 30% higher than measured. For most mantle minerals, the two agree closely.
Peiyu Zhang, Liang Yuan and colleagues at the China University of Geosciences in Wuhan, the University of Bayreuth in Germany and the University of Michigan suspected the samples. Every laboratory measurement used polycrystals made from glass, with grains only tens of nanometres across — so lots of grain boundaries. Thin disordered layers at those boundaries, or leftover glass, would barely show in X-ray diffraction yet could soften the material.
Millions of atoms
To test this, the team trained a machine-learning model of interatomic forces on quantum calculations covering 0–100 gigapascals and 0–6,000 kelvins, accurate enough to simulate huge systems. They first checked the basics: in the lower mantle, davemaoite is cubic on average. A perfect single crystal of 20,480 atoms still came out more than 10% too fast for shear waves compared with experiment — so neither simulation size nor a nearby phase change explained the gap.
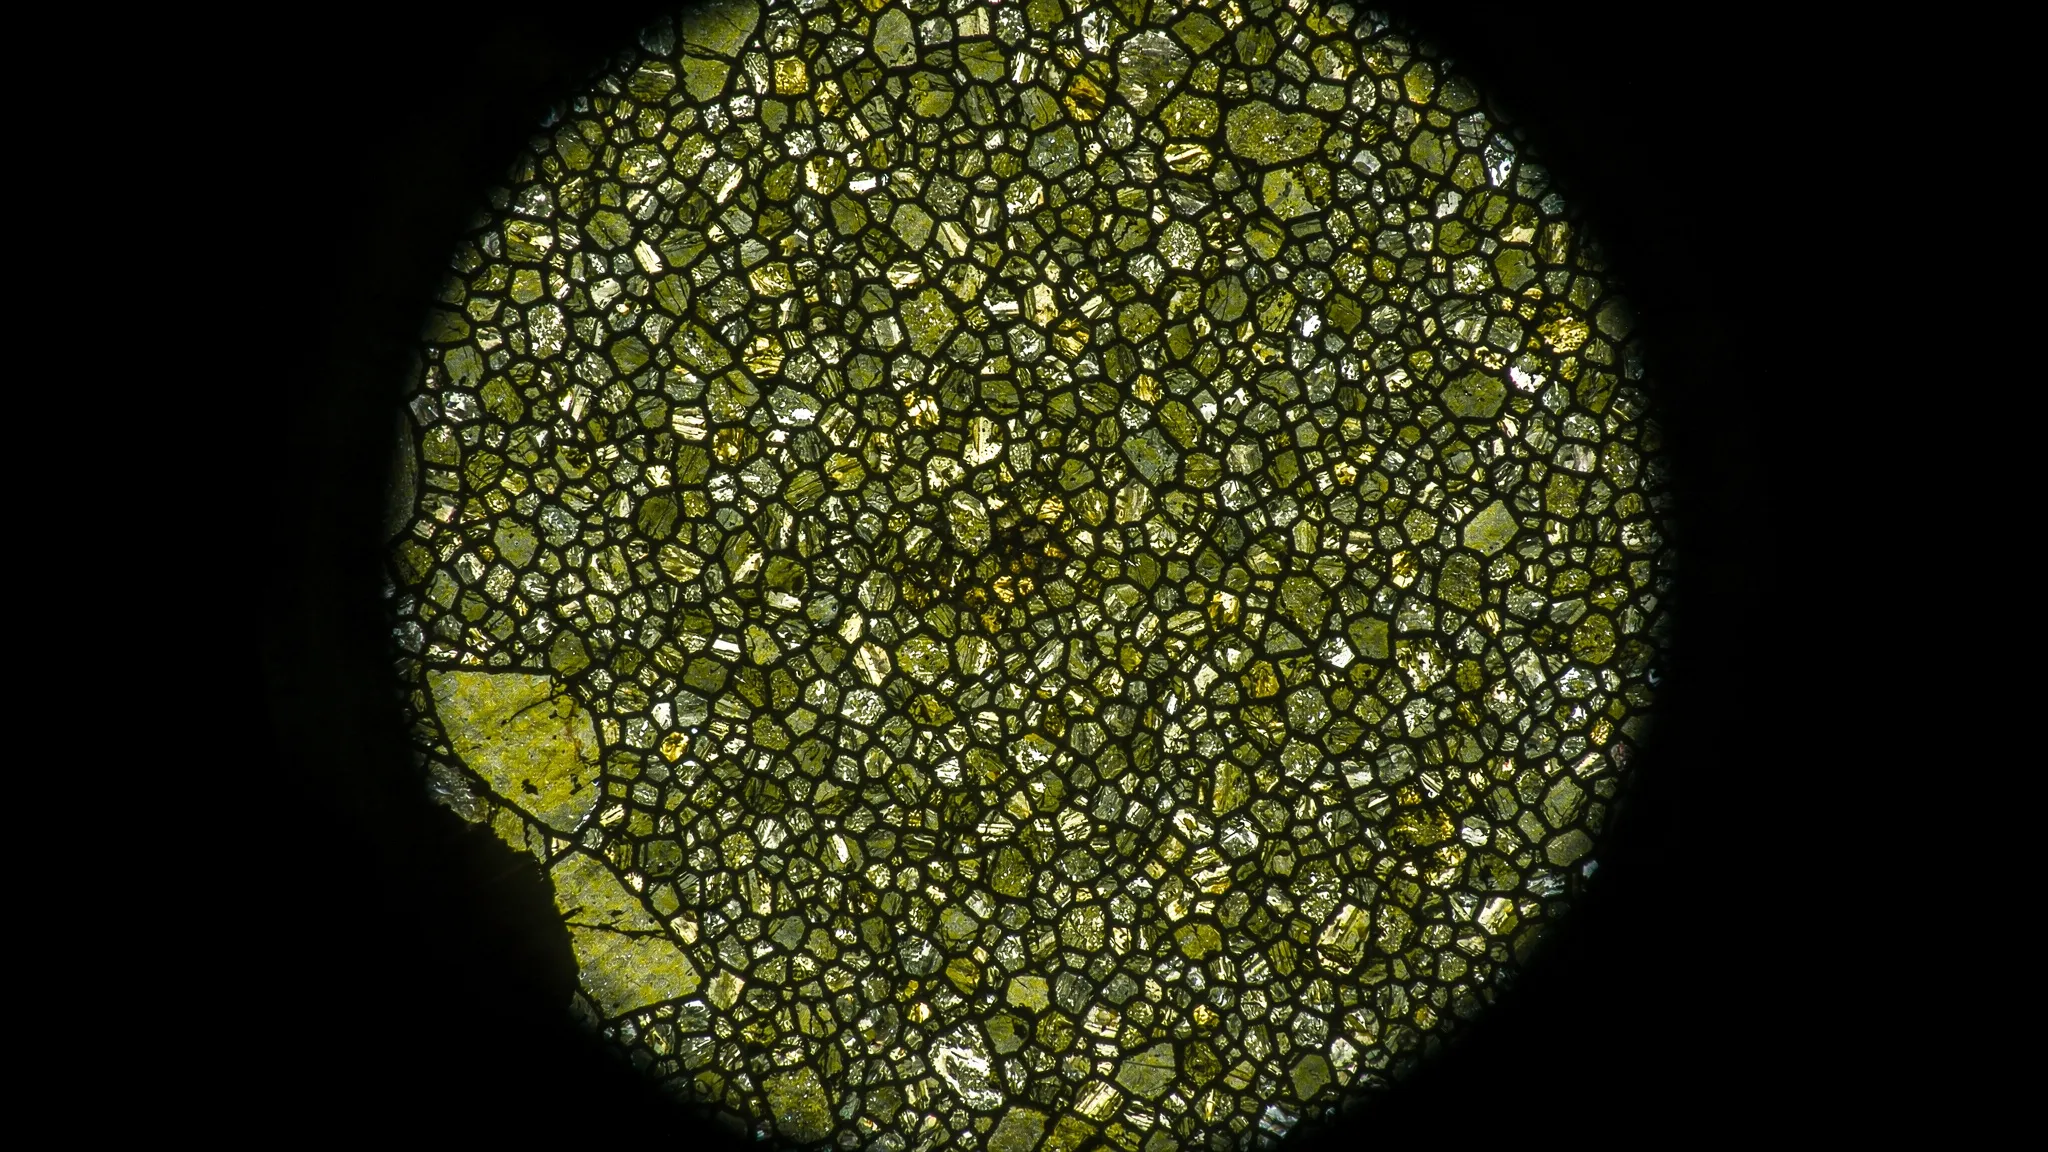
Then they built boxes about 30 nanometres wide containing 15, 120 or 480 randomly oriented grains, up to 3.4 million atoms, at 50 gigapascals and 2,142 kelvins. The finer the grains, the larger the disordered fraction: 1.8, 3.5 and 5.8% by volume.
Small disorder, large softening
Between a perfect crystal and the 480-grain sample:
- the shear modulus fell by 37% (213 to 136 gigapascals);
- the bulk modulus fell by only 12%;
- shear-wave speed dropped 19.3%, compressional-wave speed 10.6%.
A few percent of grain-boundary disorder is therefore enough to bring theory in line with experiment. Simulated X-ray patterns barely change over the same range, which is why experimenters could not see it. The polycrystal behaves like the softest arrangement physics allows: its stiffness is set by a connected network of compliant boundaries.
A floor for grain size
Fed into models of mantle rock, softened davemaoite produces an LLSVP-like signature in basalt-rich material: shear waves 6.2% slower than pyrolite, compressional waves only 1.9% slower. The authors stress that this demonstrates a mechanism, not that such fine grains exist down there.
Turned around, the relation gives a constraint. The disordered fraction scales roughly as the boundary width (about 1 nanometre) divided by the grain size. To keep the modest compressional-wave anomalies seen in LLSVPs, that fraction must stay below about 1%, so grains must be at least about 100 nanometres across. This floor agrees with models of grain growth in the convecting mantle and with the seismic evidence for coarse-grained LLSVPs.
The simulations use pure calcium silicate, while natural davemaoite carries sodium, potassium, iron, aluminium and titanium, and their grains are far smaller than real mantle grains. The team proposes three laboratory routes — total X-ray scattering, Raman imaging and nanoscale chemical mapping of boundaries — to measure, at last, how much disorder hides in the samples that have been setting the numbers.