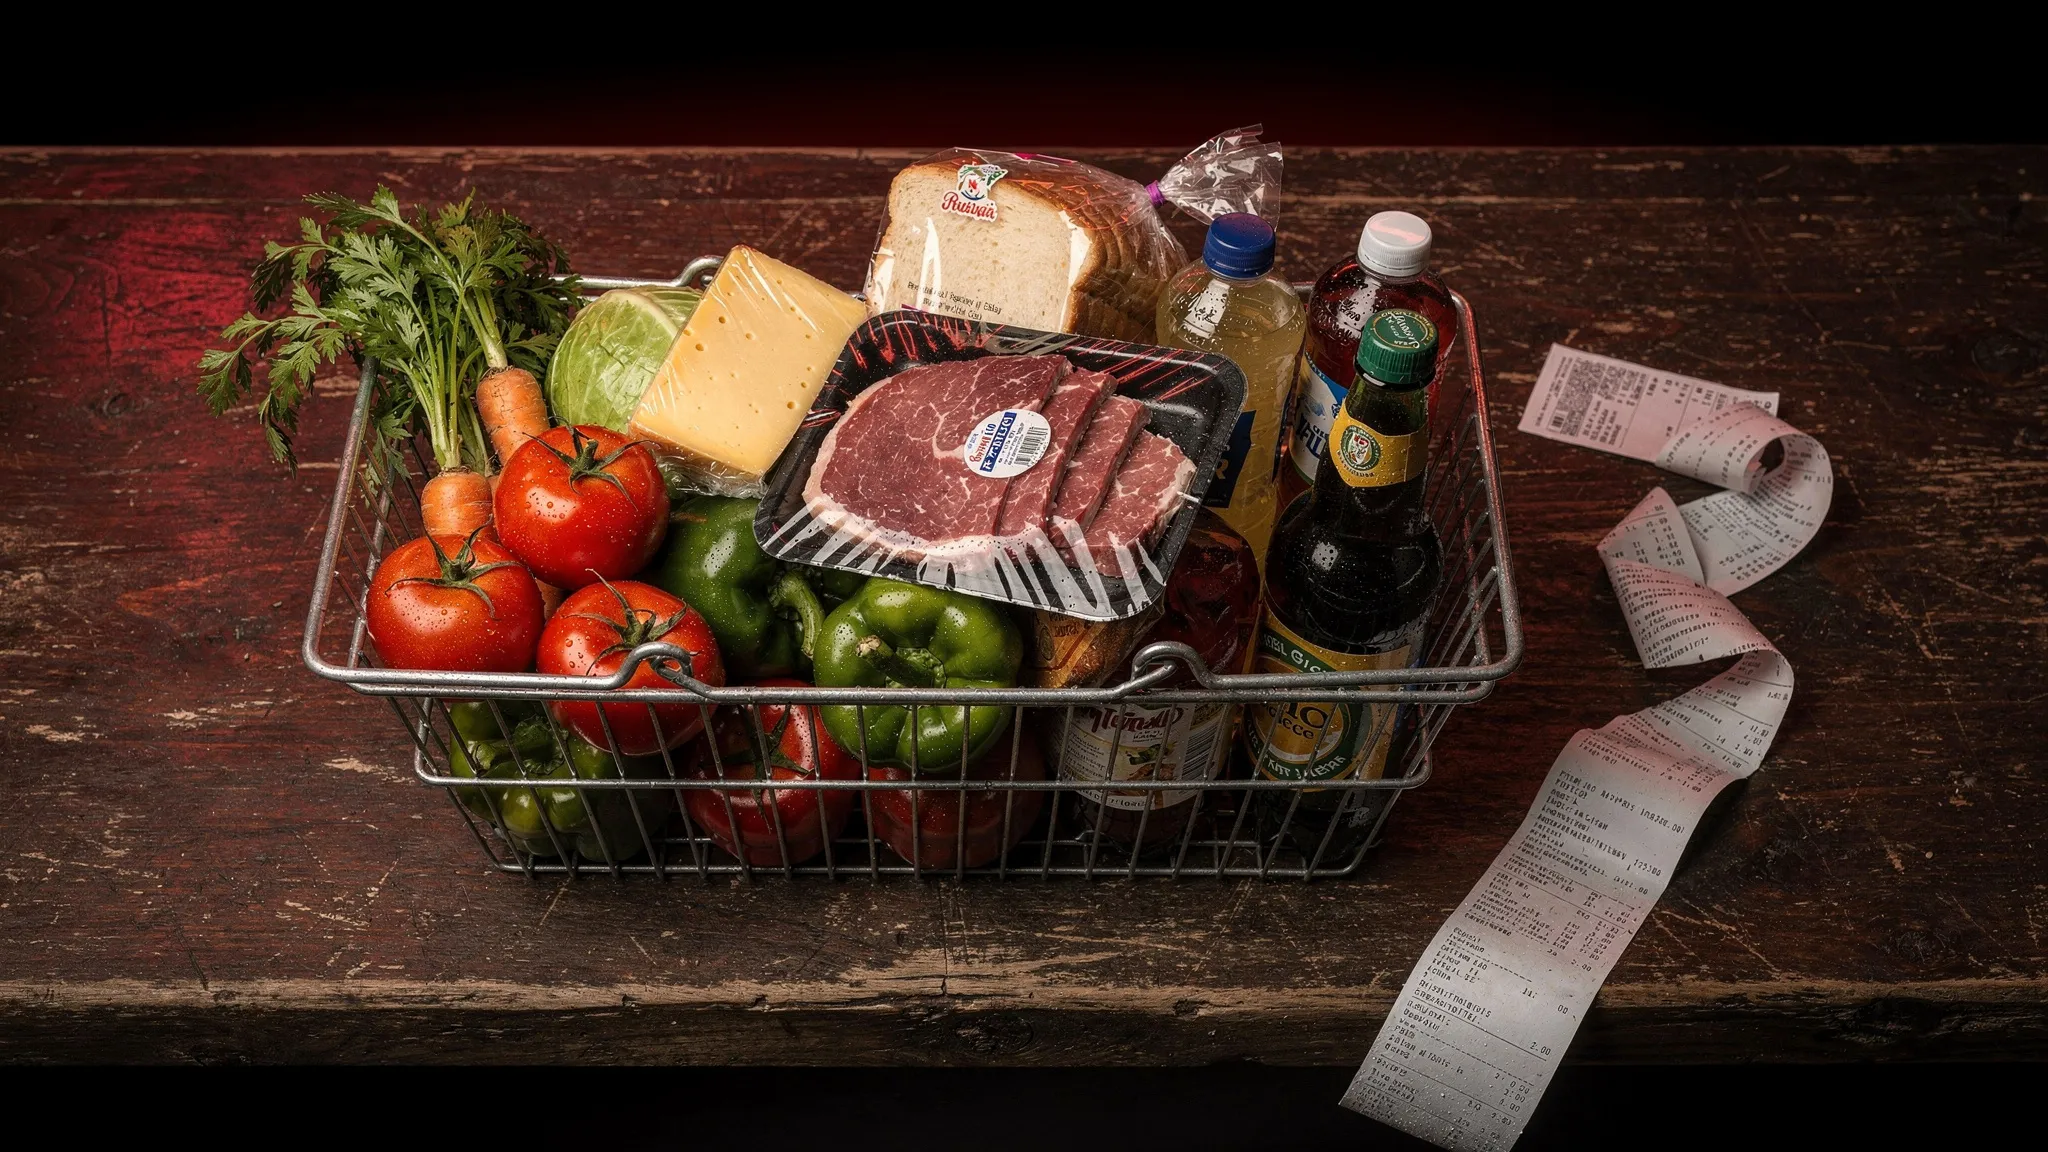
WHAT A TOWN'S SHOPPING BASKETS SAY ABOUT ITS HEART
Unhealthy diets are a major driver of heart disease and type 2 diabetes, and these risks are not spread evenly across a country. Measuring what people actually eat, place by place, is hard: surveys rely on what people remember and report, cost a lot and cover few places. Nutrition researchers also know that foods are eaten in combination, and that dietary patterns reveal links with disease that single foods miss.
Supermarket receipts record purchases on a huge scale. Yet they are almost always boiled down to totals per product — throwing away exactly the information about which foods go together.
51 million receipts
Antonio Desiderio, Leonardo Rodovero and Sune Lehmann, at the Technical University of Denmark and the University of Copenhagen, worked with Salling Group, Denmark’s largest retailer. They analysed 51 million receipts from 553 Netto supermarkets in 95 of Denmark’s 98 municipalities, collected over 79 days in early 2025. Denmark is a good testing ground: about 85% of consumers describe their latest dinner as home-made, leftovers or built from ready-made parts, so groceries capture much of what people eat.
After removing non-food items, the team grouped foods into 3,405 “products” and linked each one to the national food-composition database, which gives its nutrients; a computer model then estimated how processed each product is. For health, they used official 2024 statistics: the share of residents in each municipality who picked up at least one prescription for diabetes drugs, cardiovascular drugs or lipid-lowering drugs (drugs that lower fats in the blood) — a proxy for treated disease, not a diagnosis.
Beyond popularity
Milk and bread end up in the same basket as almost anything, simply because nearly everyone buys them. To see real affinities, the team compared every pair of products with a statistical null model that keeps the size of each basket and the popularity of each product, but shuffles everything else. Only pairs bought together far more often than chance survive. What is left is a “backbone” of genuine food pairings, one for each municipality.
Same products, different pairings
Product ranges are strikingly similar across the country. But the way foods are combined is not. Denmark’s four largest cities — Copenhagen, Aarhus, Odense and Aalborg — form a distinct cluster, and the other municipalities spread along a continuous gradient away from that urban core.
Some pairings fade with distance from the cities. Vegetables with cheese drop from 1.34% of the backbone in the urban core to 0.38% in the most outlying group; vegetables with fish fall to a third of their urban share. Others grow: fruit with vegetables rises from 4.16% to 6.27%, fruit with fruit from 1.89% to 3.49%, white bread with meat nearly doubles its share, and drinks with drinks almost triples it, while remaining a small slice.
What the pairings say about health
Pooling all receipts, the team found 12 dietary communities — groups of foods bought together, such as Ready meals, Cheese & cold cuts, Candy & snacks, Wine & beer, or Pasta & toppings. They then measured, in each municipality, how much more often than chance the foods of each community ended up in the same baskets — its cohesion.
That cohesion helps predict prescription rates. Age, income and population size alone explain a large part of the differences between municipalities. Adding the network explains a further 18% to 63% of what remains, depending on the type of medicine. Even after removing the effect of how popular the products are locally, combinations still explain about a quarter to a half of what age, income and population size leave unexplained. Across municipalities — an association, not a cause — where Candy & snacks and Cheese & cold cuts are bought more cohesively, more residents take diabetes drugs; Wine & beer tracks cardiovascular and lipid-lowering medicines.
Ultra-processed, everywhere and at the edge
Ultra-processed foods make up 46% to 56% of purchases depending on the municipality, with no link to distance from the cities. Shoppers do not make separate “healthy” and “junk” trips: baskets holding both minimally processed and ultra-processed items account for 76.6% of the food volume analysed. Yet in every one of the 95 municipalities, ultra-processed products tend to have fewer partners in the network than minimally processed ones. They ride along with fresh foods, but rarely form the pairings that hold the network together.
Pairings, not proof
The authors list the limits plainly. Receipts show what a household buys, not what each person eats, and they miss food bought elsewhere. The study compares municipalities at one point in time: it shows associations, not causes, and the shoppers are not necessarily the same people as the patients.
Still, the results point to a blind spot in nutrition policy. Sugar taxes and front-of-pack labels judge one product at a time, and cannot see combinations. Retailers, the authors suggest, could act on the pairings themselves — through which products are placed or promoted together, or by bundling healthier ingredients in price offers.