ONE MILLION DATA CENTRES IN ORBIT, AS SEEN BY RUBIN
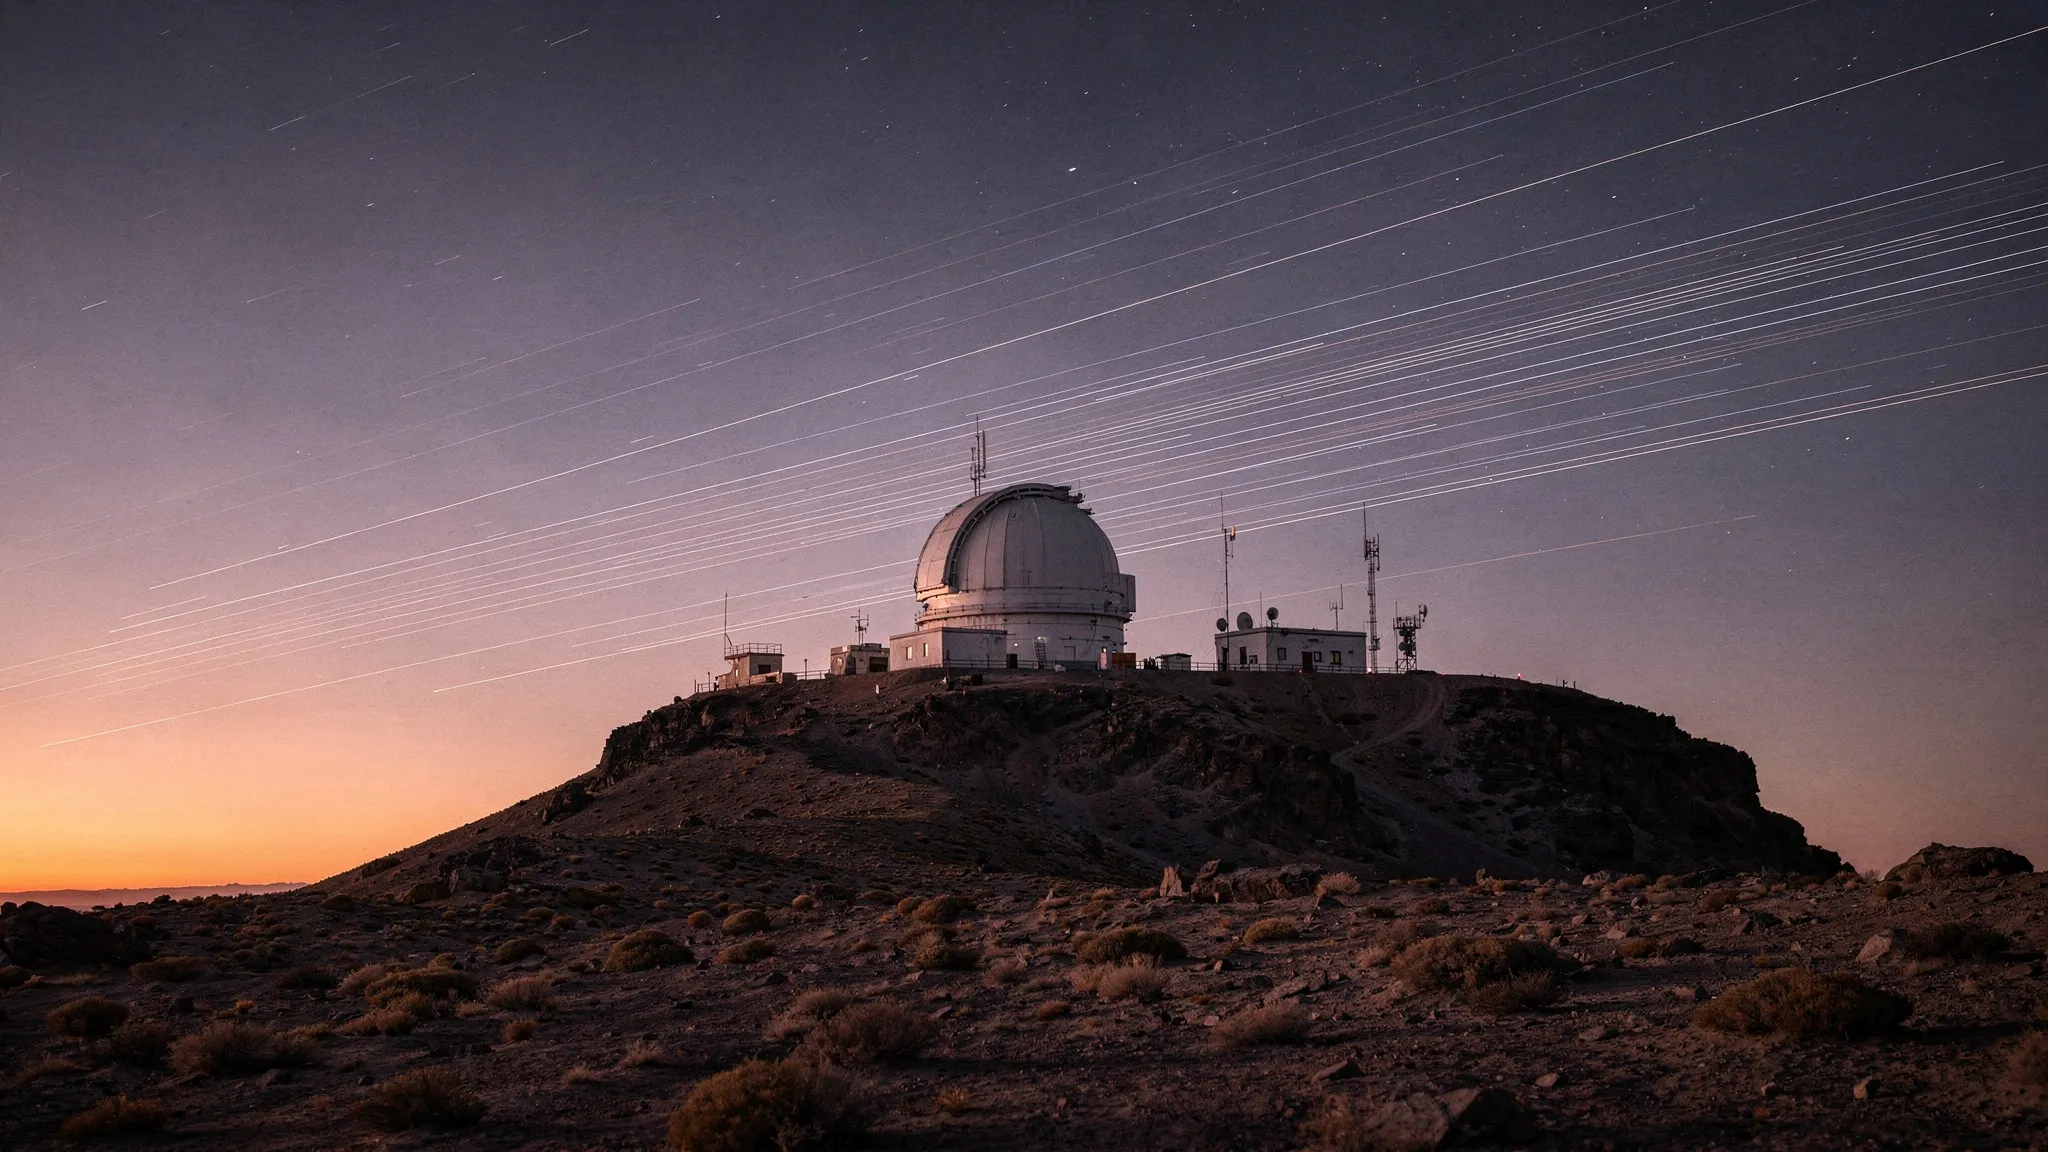
At 2,663 metres on Cerro Pachón, in Chile, the Vera C. Rubin Observatory began operating in 2025. Its wide-field telescope, with an 8.36-metre main mirror, and its extremely sensitive camera carry out the Legacy Survey of Space and Time (LSST). In its first year alone, the survey will collect more data than all previous optical astronomy observations combined.
Meanwhile, operators are racing to launch a new kind of satellite: orbital data centres, spacecraft that carry computers. Filings with the US Federal Communications Commission from SpaceX and Starcloud, along with plans from Axiom Space, Orbital, Blue Origin, Project Suncatcher and others, together propose well over one million of them in low orbit. In June 2026, only a few prototypes had flown.
A swarm built from a filing
Nayan Jangid and Siegfried Eggl (University of Illinois Urbana-Champaign), Meredith Rawls and Peter Yoachim (University of Washington and Rubin Observatory) and Connie Walker (NSF NOIRLab), all also members of the IAU Centre for the Protection of the Dark and Quiet Sky, built a model constellation from SpaceX’s filing: 998,240 satellites on 94 orbital shells (altitude layers) between 686 and 1,002 km up. Half sit on orbits tilted about 30 degrees to the equator. The other half are Sun-synchronous: their orbits follow the boundary between day and night.
Each satellite is modelled as a scaled-up Starlink-like craft: a body about 7 by 3.5 metres, solar panels sized for 400 kilowatts, and a white or silvered radiator with two faces of 110 square metres each to shed the computers’ heat.
A six-stage pipeline then followed every satellite through one simulated year of Rubin’s schedule: which 30-second exposures it crosses, whether it is sunlit, how bright its streak looks in each of the camera’s six colour filters, and how many pixels it ruins.
Four images in five, on the worst nights
On average, the simulation counts about 180,000 satellite passages through Rubin’s field of view and 60,000 sunlit streaks per night. On some nights, depending on the time of year, up to 80% of Rubin’s images contain at least one illuminated streak; averaged over the year, the share is closer to 20%. That figure covers the whole constellation and every filter; the paper names no single night, and the peaks are scattered through the year.
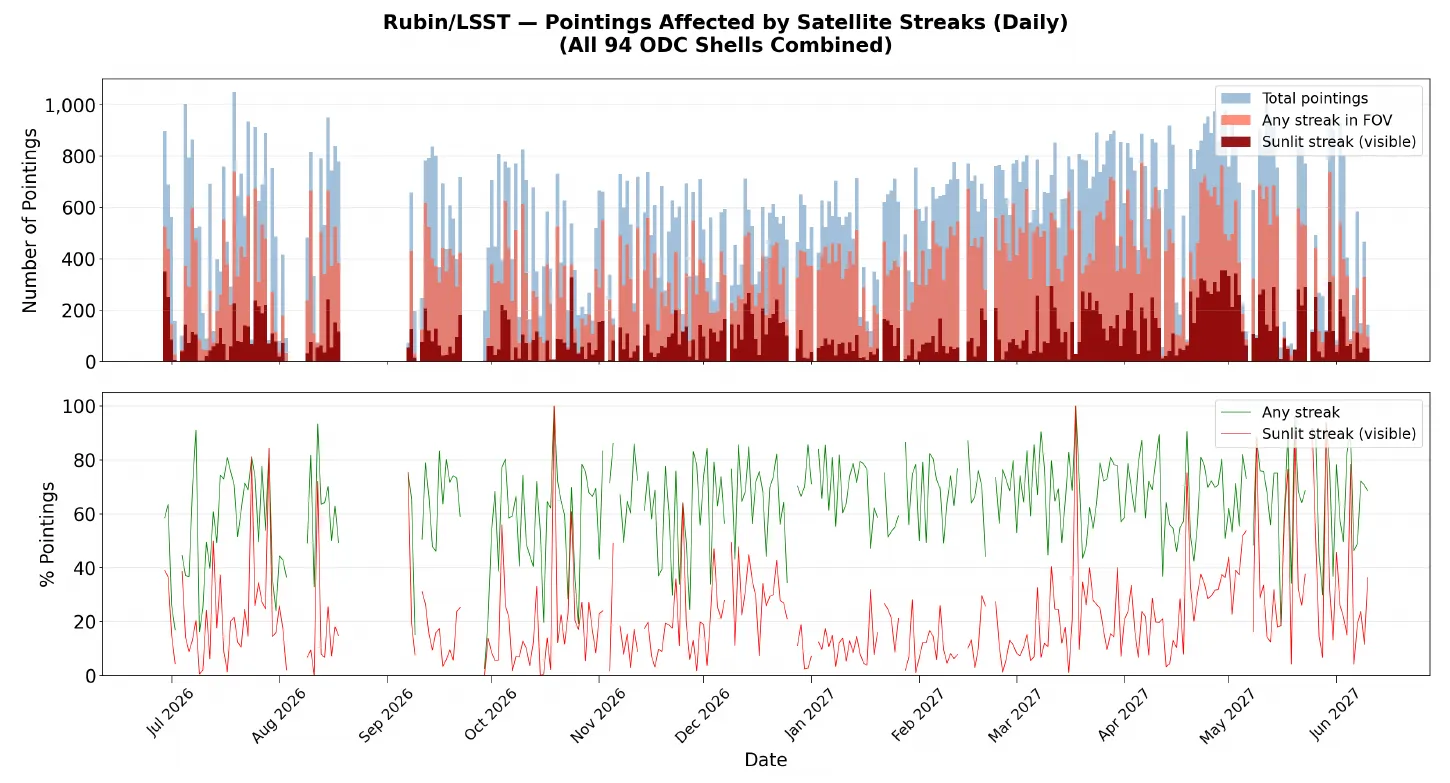
Night by night over one simulated year: in green, the share of Rubin images crossed by any satellite; in red, by a sunlit, visible one. Gaps are nights without observations. — Figure 1, Jangid et al. (2026), arXiv:2610.31772.
Sun-synchronous satellites do disproportionate damage: riding along the day-night boundary, they stay lit when the observatory is already dark.
Brightness follows two regimes. Diffuse reflection typically gives a magnitude around 6; on that scale, lower numbers mean brighter. Mirror-like glints off the giant solar panels reach magnitude 2 to 4. Over the year, 83.9% of some 9 million sunlit streaks are brighter than magnitude 7, the limit recommended by the International Astronomical Union, and more than 229,000 are brighter than magnitude 2, easily visible to the naked eye; for those, the model writes off each detector chip the streak crosses (the camera has 189).
In twilight, a typical image holds about 100 visible streaks at once. Rubin would lose 5 to 10% of its twilight pixels on a typical night, and single images more than 90%. The authors flag that their method probably overestimates how many streaks are bright enough to overflow pixels (saturate).
A glowing twilight
Adding up the light of every sunlit satellite above the horizon, the team also computed how much brighter the sky itself becomes. On a representative moonless night, 15 July 2026, the satellites add more than 1,000% of the natural sky glow during twilight in the u (near ultraviolet), g (green) and r (red) filters; in figure 11, the g band peaks above 3,000% before dawn. The g and r filters are typically the ones used at twilight to discover potentially hazardous objects of the Solar System. In the deepest part of the night, when the satellites fall into Earth’s shadow, the excess drops to almost nothing. Even under a full Moon, the sky glow rises by more than 100% in several filters. The authors suggest this brightening may turn out to be the dominant harm to science.
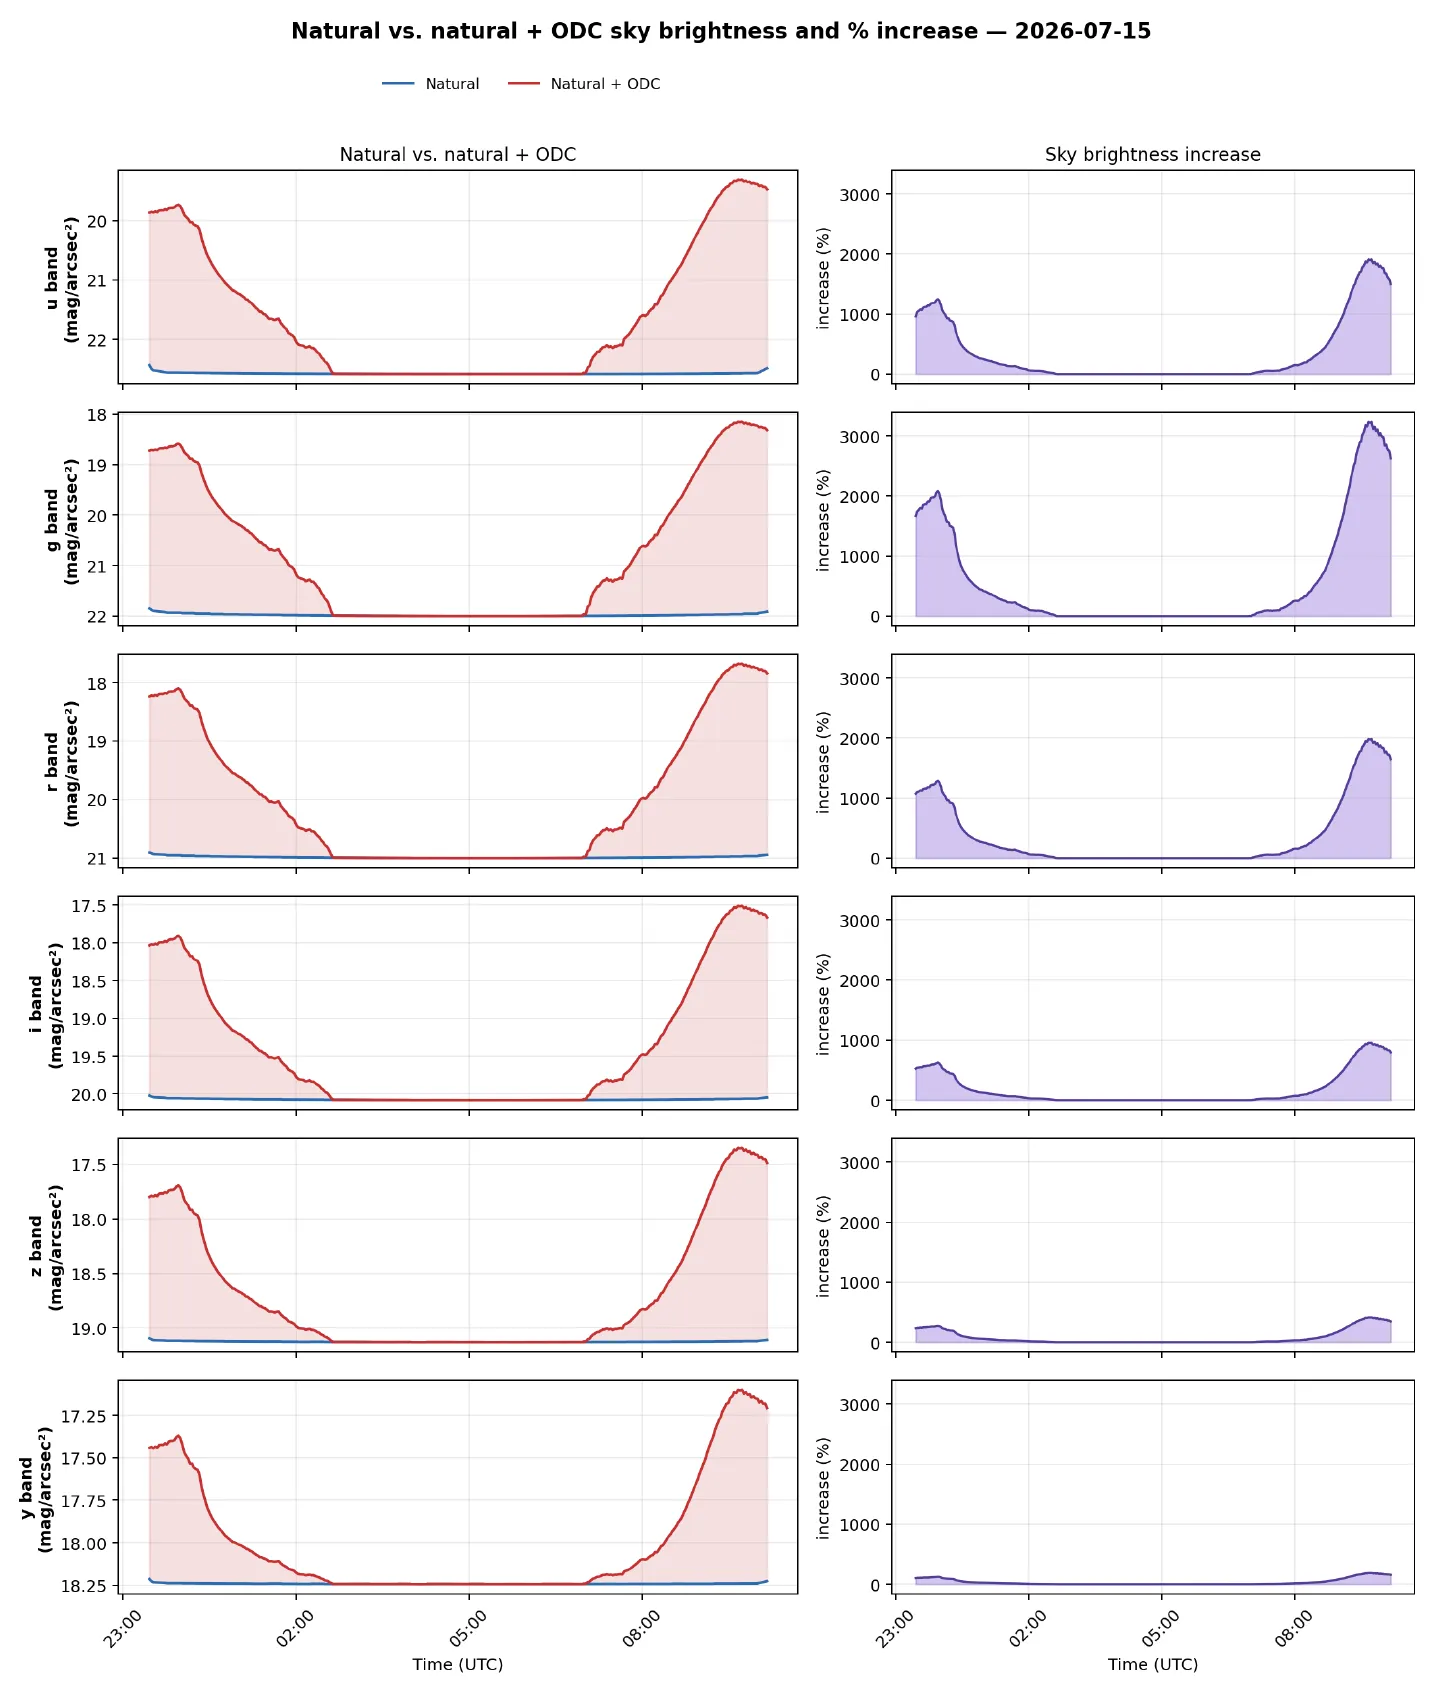
Sky brightness through the moonless night of 15 July 2026, from the u filter (top) to the y filter (bottom): in blue the natural sky, in red with the satellites; on the right, the percentage increase, highest at dusk and dawn. — Figure 11, Jangid et al. (2026), arXiv:2610.31772.
No easy fix
The team tested the usual remedies. With only 10% of the constellation, about 100,000 satellites, twilight images still lose 2.33% of their pixels per night, against 6.88% with the full fleet, and one image loses 87%. A tenfold cut does not divide the damage by ten, because a single bright glint is enough to dominate an image. Lower orbits keep satellites in shadow longer, but glints remain at twilight and shorter lifetimes mean more launches. Operators could steer glints away from Chile, but only one company and one observatory at a time. Pointing Rubin east at dusk and west at dawn looks promising, but was not simulated.
The study has its own blind spots: idealised orbits whose every position is known exactly, no space debris, no dark satellites passing in front of stars, no radio astronomy. And one of the harms it lists cannot be undone: for a phenomenon seen only once, a bright streak across the wrong detector means the event is simply missed, with no chance of a follow-up.