THE WORLD'S CO2 STALLS IN 2026, BY CANCELLING ITSELF OUT
Global CO2 emissions from fossil fuels and industrial processes remain close to their historical highs, but their growth has slowed. The question is what comes next: a high plateau, or the start of a lasting decline? Official inventories take time to compile and review, so the answer usually arrives late. Tao Li, Zhu Deng, Zhu Liu and colleagues at Tsinghua University, the University of Hong Kong, the Laboratoire des Sciences du Climat et de l’Environnement in France, Stanford University and Jilin University have tried to answer it for 2026 before the year is even over.
Nine months measured, three months forecast
The team works with Carbon Monitor, a dataset that estimates CO2 emissions day by day: in each sector, activity data are multiplied by emission factors. The world is split into 47 series: nine regions (China, the United States, the European Union, India, Russia, Japan, Brazil, the United Kingdom and the rest of the world), each with its power, industry, ground transport, residential and domestic aviation emissions, plus international aviation and shipping.
The data run from 1 January 2019 to 30 September 2026. For the last 92 days of the year, each series is extended by a statistical model, Prophet, that combines a trend with yearly and weekly rhythms and holidays. The measured part already accounts for 74.2% of the year’s total.
The year was not an easy one to read: El Niño conditions were developing, and from late February disruptions hit energy and transport markets in the Middle East.
A near-zero made of large opposite moves
The headline: 38.1 billion tonnes (gigatonnes) of CO2 in 2026, an increase of 36.6 million tonnes, or +0.10%, over 2025. That is about 104 million tonnes a day.
But the global figure hides much bigger movements. Regions where emissions rise add 0.32 gigatonnes; regions where they fall remove 0.29 gigatonnes. Of the 0.61 gigatonnes of combined movement, 94.0% cancels out in the global sum. The global growth rate alone, the authors write, “can conceal both substantial reductions and continuing expansion”.
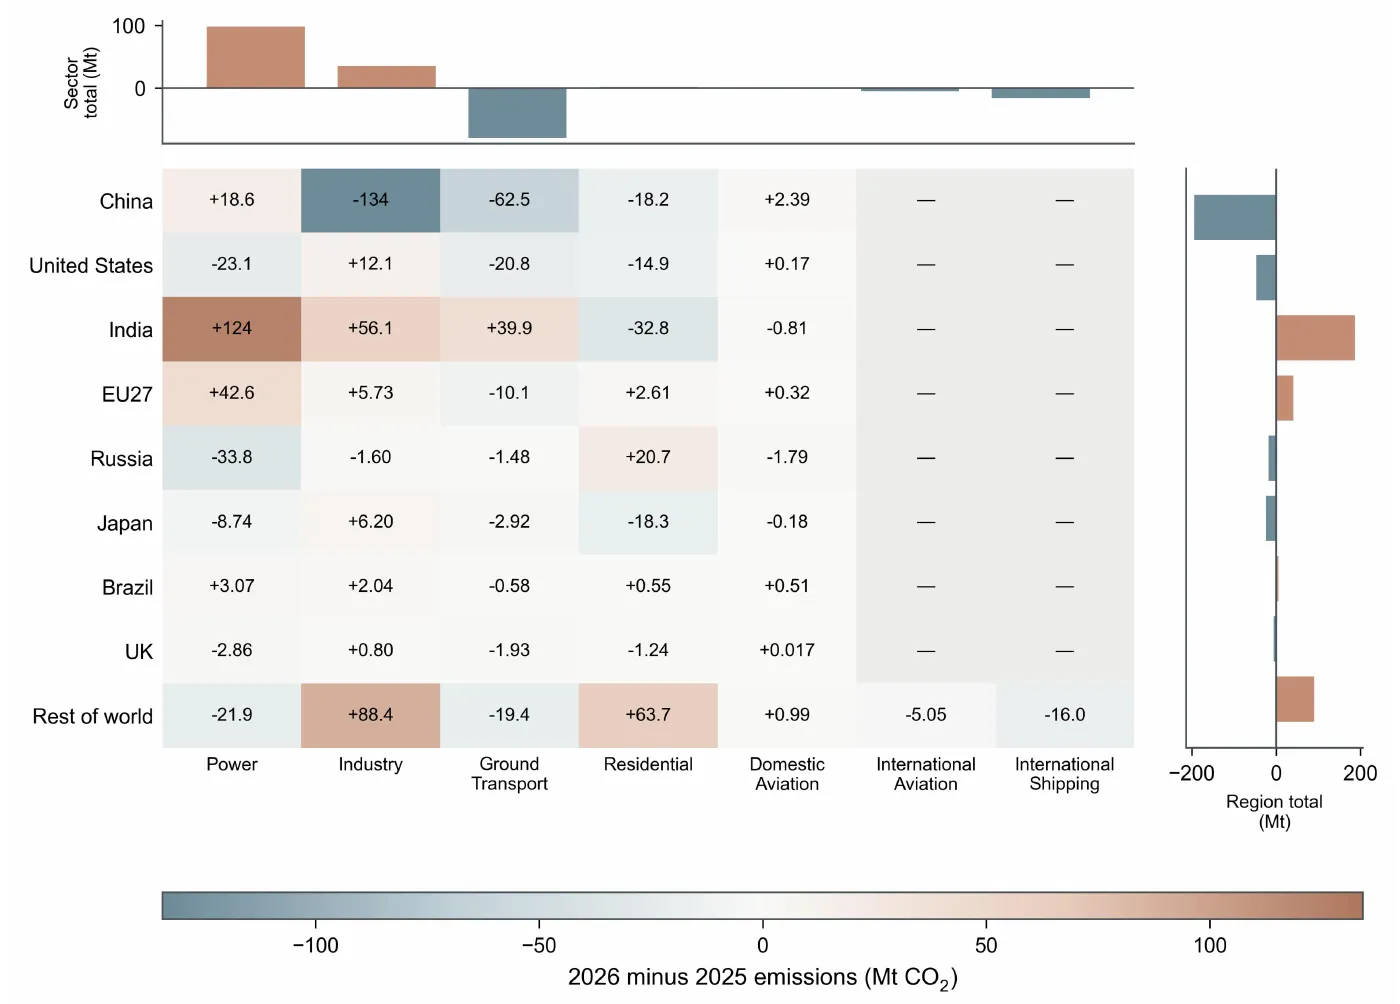
Change in emissions from 2025 to 2026 for each region and sector, in millions of tonnes of CO2: blue for decreases, brown for increases. China’s industry and ground transport and India’s power sector dominate. — Figure 4, Li et al. (2026), arXiv:2611.22406.
China: less heavy industry, more electric cars
China, which emits 11.9 gigatonnes (31.2% of the world total), records the largest drop: −194 million tonnes (−1.61%), two-thirds of all regional decreases. Industry accounts for −134 million tonnes and ground transport for −62.5 million. Official Chinese statistics cited by the authors show manufacturing value added still growing while crude-oil refining, vehicle output, cement and rolled steel declined. On the roads, new-energy vehicles made up 49.4% of new car registrations in the first half of 2026, though only 13.2% of the fleet. It is China’s third decline in a row, after −47.3 million tonnes in 2024 and −99.4 million in 2025.
India: demand outruns clean power
India posts the largest rise: +187 million tonnes (+5.67%), to 3.48 gigatonnes. Power plants alone add 124 million tonnes, industry 56.1 million. Peak demand hit a then-record 256 gigawatts on 25 April. By the end of July, non-fossil sources made up more than 54% of installed capacity — yet coal and lignite still supplied 69.5% of the electricity delivered from April to June. The lesson the authors draw: what lowers emissions is the clean electricity actually generated, not the capacity installed.
Worldwide, power emissions rebound by 98.1 million tonnes after falling in 2025, while ground transport declines by 79.7 million tonnes — the first drop after rising every year from 2021 to 2025.
Heatwaves hidden in summer averages
Daily data also reveal short episodes that monthly figures smooth away. Between 16 and 30 June, power-sector emissions ran above their expected level: +124% in France, +47.8% in the United Kingdom, +17.3% in Italy, +7.51% in India. In absolute terms, though, India’s excess (5.51 million tonnes) dwarfs France’s (0.32 million), because their baselines differ enormously. In Spain, the 55 days of heat show a +8.32% excess, while the June–August average is −3.91%. The authors stress that these are associations in time, not proof of cause.
How solid is +0.10%?
The team is frank about the fragility. The range covering 68% of its simulations runs from +0.011% to +0.18%, and there is a 12.4% chance that emissions actually fell. Completing the year differently — by copying October to December 2025 — gives −0.066%: “the sign of the small annual change depends on the projection method”. Tests on the five previous years show Prophet tracks daily emissions better than this simple copy, but misses annual totals by more on average (117 versus 66.7 million tonnes).
Plateau or tiny dip, the picture underneath stays the same. Sustained global reductions, the authors write, will require falling emissions where they are already established to be matched by lower-carbon ways of meeting demand in the economies that are still expanding.