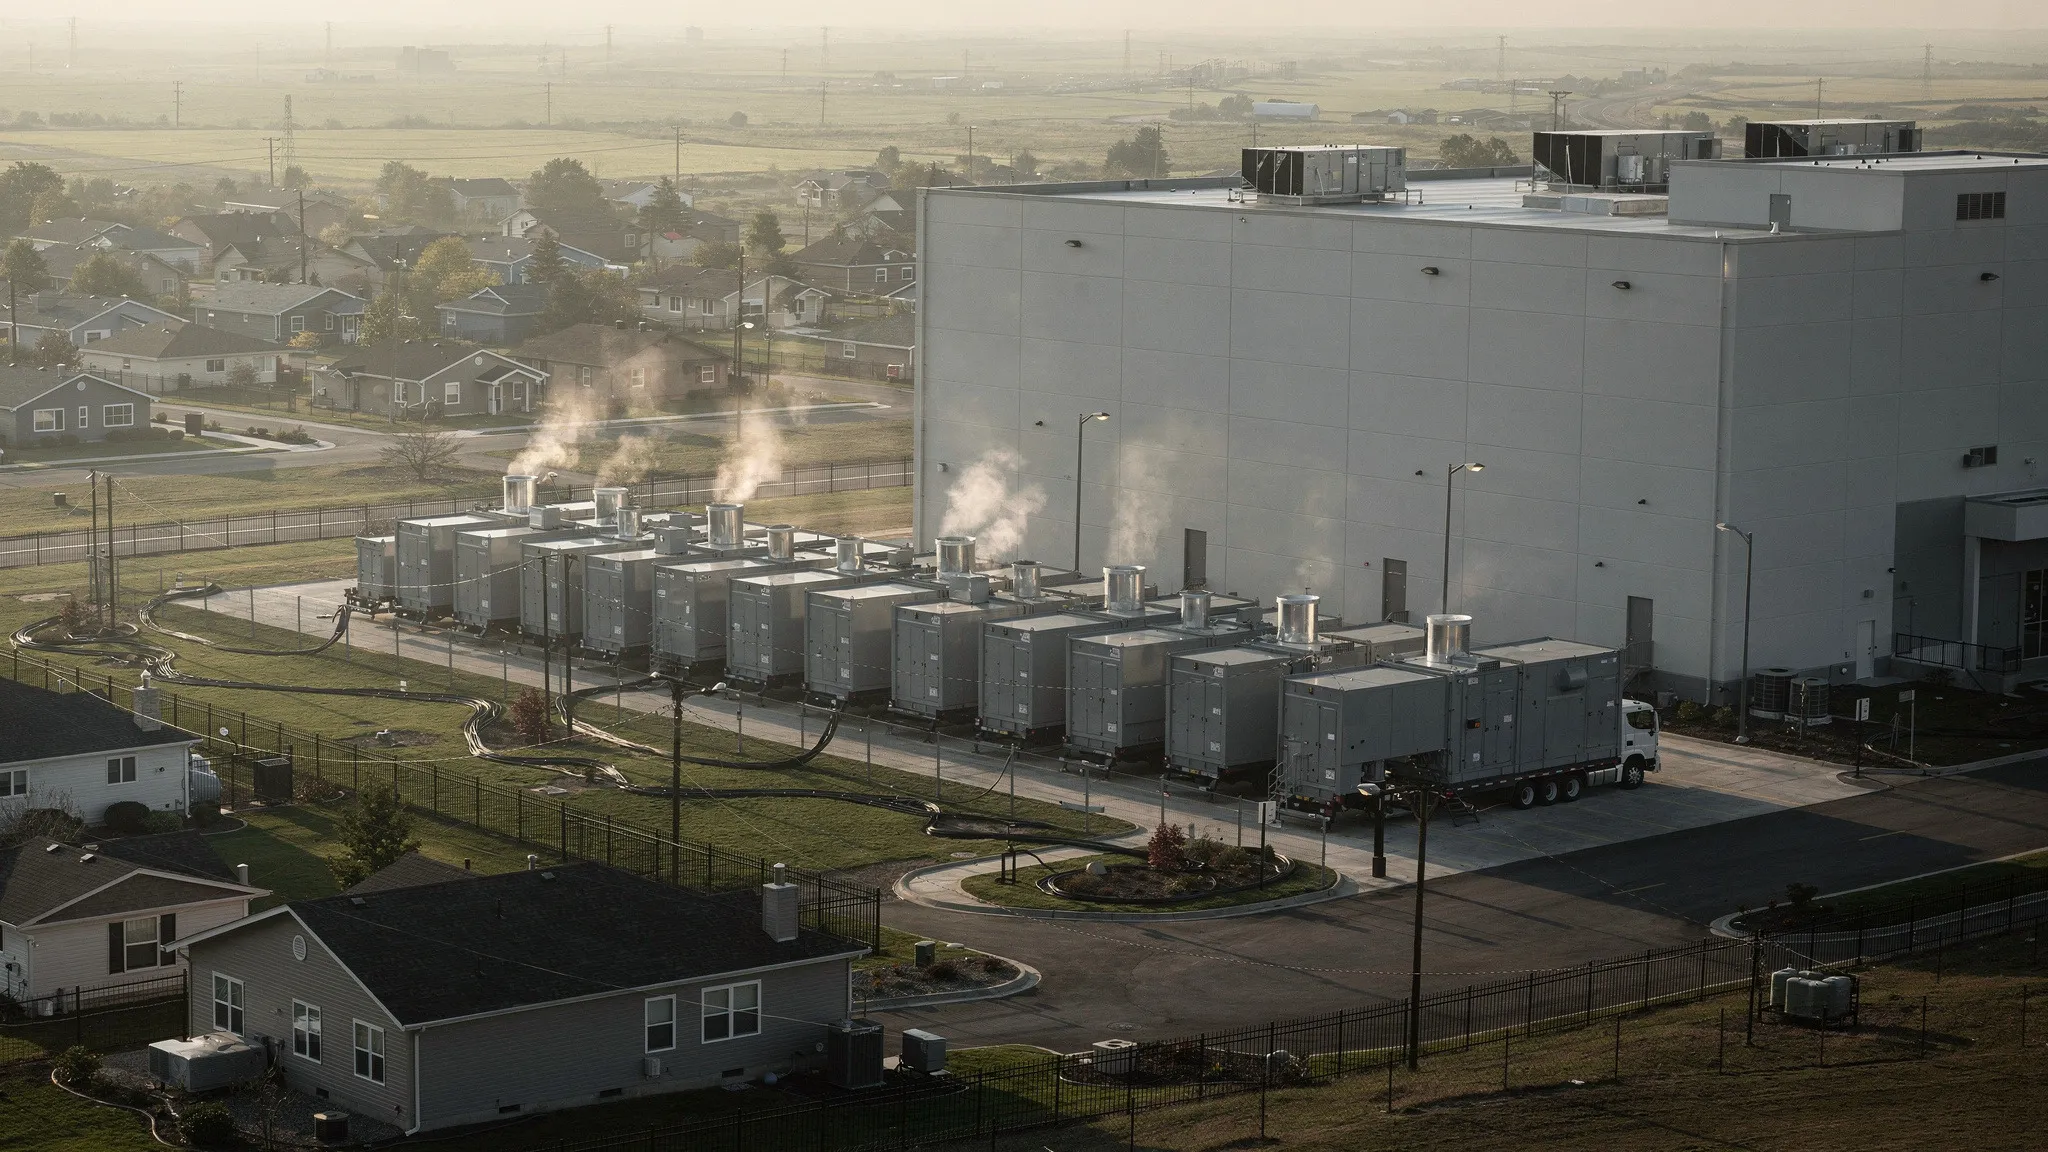
AN AI DATA CENTRE'S TURBINES, SEEN FROM SPACE
US data centres used about 4.7% of the country’s electricity in 2024, and could use 9.5 to 15.3% by 2030, largely because of artificial intelligence. Connecting a large one to the grid can take years, so some developers now make their own power on site. In the first half of 2026, gas-fired capacity in development to power data centres directly nearly doubled, to 189 gigawatts.
Burning gas releases nitrogen oxides. They raise the level of nitrogen dioxide (NO₂) in the air and help form ozone and fine particles, which harm the health of people nearby and downwind. Yet, as Will Qiang, Bo Huang, Xingjian Liu and Harry Lee — geographers and urban planners at the Chinese University of Hong Kong and the University of Hong Kong — point out, the pollution these on-site generators create had rarely been measured directly.
A fleet classed as mobile
Their case is the fleet of gas turbines, run by MZX Tech LLC, that powers SpaceXAI’s Colossus 2 data centre. It stands in Southaven, Mississippi, about 1.6 kilometres south of the Tennessee state line. By May 2026 it had grown to about 1.5 gigawatts — comparable, the authors note, to the largest nuclear reactor in the United States — and to about 1.8 gigawatts by July.
Mississippi regulators allowed its units to run as mobile sources: turbines on movable chassis, planned to stay less than 12 months, exempt from the permits and emission limits of a power plant. The fleet publishes no hourly emissions, and the nearest recently active official NO₂ monitor is about 25 kilometres away.
The view from orbit
The team turned to TEMPO, an instrument in geostationary orbit — it stays above the same point on Earth — that observes every daylight hour. It measures the NO₂ “column”: the amount of gas in the air above each patch of ground. The team compared each 2026 scan around the turbines with the scans taken on the same day, at the same hour, in 2024 and 2025 — which cancels out the seasons — and subtracted the background of the surrounding area.
From April to July 2026, NO₂ within 5 kilometres of the turbines rose by about 49% of its usual level. In the same months of 2025, before the first units arrived, nothing had changed. A second satellite with a different orbit and different processing, TROPOMI, saw the same jump after years of low values. Compared with 656 urban locations across the United States, Southaven’s 2026 rise was the most anomalous: an anomaly score — the 2026 rise measured against each place’s usual year-to-year swings — of 4.63, when no other location exceeded 1.82, and no location had ever passed 2.68 in any year since 2020. In late summer, the increase was about 2.4 times larger still.
The fleet’s fingerprints
Several clues point to the turbines rather than something else:
- It grew with the fleet. The rise stayed small while capacity was below 0.7 gigawatts, then climbed as the fleet passed 1.0 and 1.5 gigawatts in spring 2026. Each extra 100 megawatts of turbines without emission controls added a measurable step.
- It follows the wind. When the scans of all three years were rotated using a single year’s winds, a band of extra NO₂ stretched downwind of the site — but only when those were the 2026 winds, the ones blowing while the turbines ran.
- It peaks in still air. Winds below 3 metres per second made up 37% of the observations but about three-quarters of the increase: the signature of a local source whose plume lingers.
- It fades with distance, falling by half about 3.9 kilometres from the turbines.
Two power plants nearby would have needed about 75 times their reported emissions to produce the rise. Construction at the site before the turbines arrived left no trace, and neither did a large data centre building site in Louisiana. None of 15 other cities seen in the same satellite scans showed a significant increase.
Across the state line
About 116,000 people live inside the hotspot, where the rise was largest. Two-thirds of them — 65.5% — live on the Tennessee side, in southern Memphis. The hotspot includes about 30,000 children and 18,000 people aged 65 or over. Seventy-six per cent of its residents are non-Hispanic Black (93% on the Tennessee side), and 27% live below the federal poverty line, against 52% and 18% in Shelby County, Tennessee, and 33% and 10% in DeSoto County, Mississippi. For the authors, this gap reflects the plume crossing the state line into predominantly Black neighbourhoods of southern Memphis.
No official NO₂ monitor sits inside the hotspot. The two nearest, 25 and 28 kilometres away, are outside it, and the satellites saw no increase over them. Meanwhile, a permanent power plant being built on the same site must treat its exhaust and monitor its emissions continuously under its permit; the temporary fleet has no such requirement, and no continuous monitoring.
Counting the harm
From the fleet roster and operating records, the team estimates emissions of about 216 kilograms of nitrogen oxides per hour — some 1,900 tonnes a year, about five times the combined annual limit of the permanent plant’s turbines. Two air-quality models then turned these emissions into fine particles and health effects.
The main model gives about 4.4 premature deaths per year, valued at about $49 million. Assuming the exhaust is released at ground level rather than from the stacks gives 5.4 to 6.0, and a more recent estimate of how particles affect mortality nearly doubles it, to about 8.5. These figures leave out particles emitted directly by the turbines, asthma linked to NO₂, and ozone.
Because the particles form over hours of travel, only half of the deaths occur within about 150 kilometres. Tennessee bears 35.2% of them, Mississippi 18.2%, and other states 46.6%: 81.8% fall outside the state that authorised the fleet.
The one-year trap
The fleet mixes two kinds of turbine. Those without selective catalytic reduction (SCR) — a standard treatment that strips nitrogen oxides from exhaust — produced about 78% of the electricity but 98% of the nitrogen oxides. Fitting SCR to all of them would avoid about 88% of the estimated deaths. Simply running the cleanest units first would avoid 20 to 34%. Per megawatt-hour, the fleet’s nitrogen-oxide damage is about 3.6 times that of the regional grid; once sulfur dioxide and directly emitted particles are counted, the two are roughly equal, because the grid’s coal plants dominate those two pollutants. With SCR, the fleet would fall below the grid in every model.
So why not require it? Because of the clock. According to the authors’ accounting, SCR on new turbines pays for itself in avoided health damage only after 9 to 10 years. Judged over a one- or two-year stay, it never does. Over a 30-year service life, counting all states, it returns 1.49 to 1.62 times its cost. Counting only Mississippi’s own damages, even 30 years gives just 0.27 to 0.29.
Yet these turbines do not vanish when their permit expires: the lessor depreciates them over 25 years, and redeployed temporary turbines elsewhere have run for years. The authors’ conclusion is that emission standards should follow the equipment wherever it goes — with satellites to check, since in Southaven they saw what the ground network could not.