WHY TIBET'S THAWING SLOPES COLLAPSE IN CLUSTERS
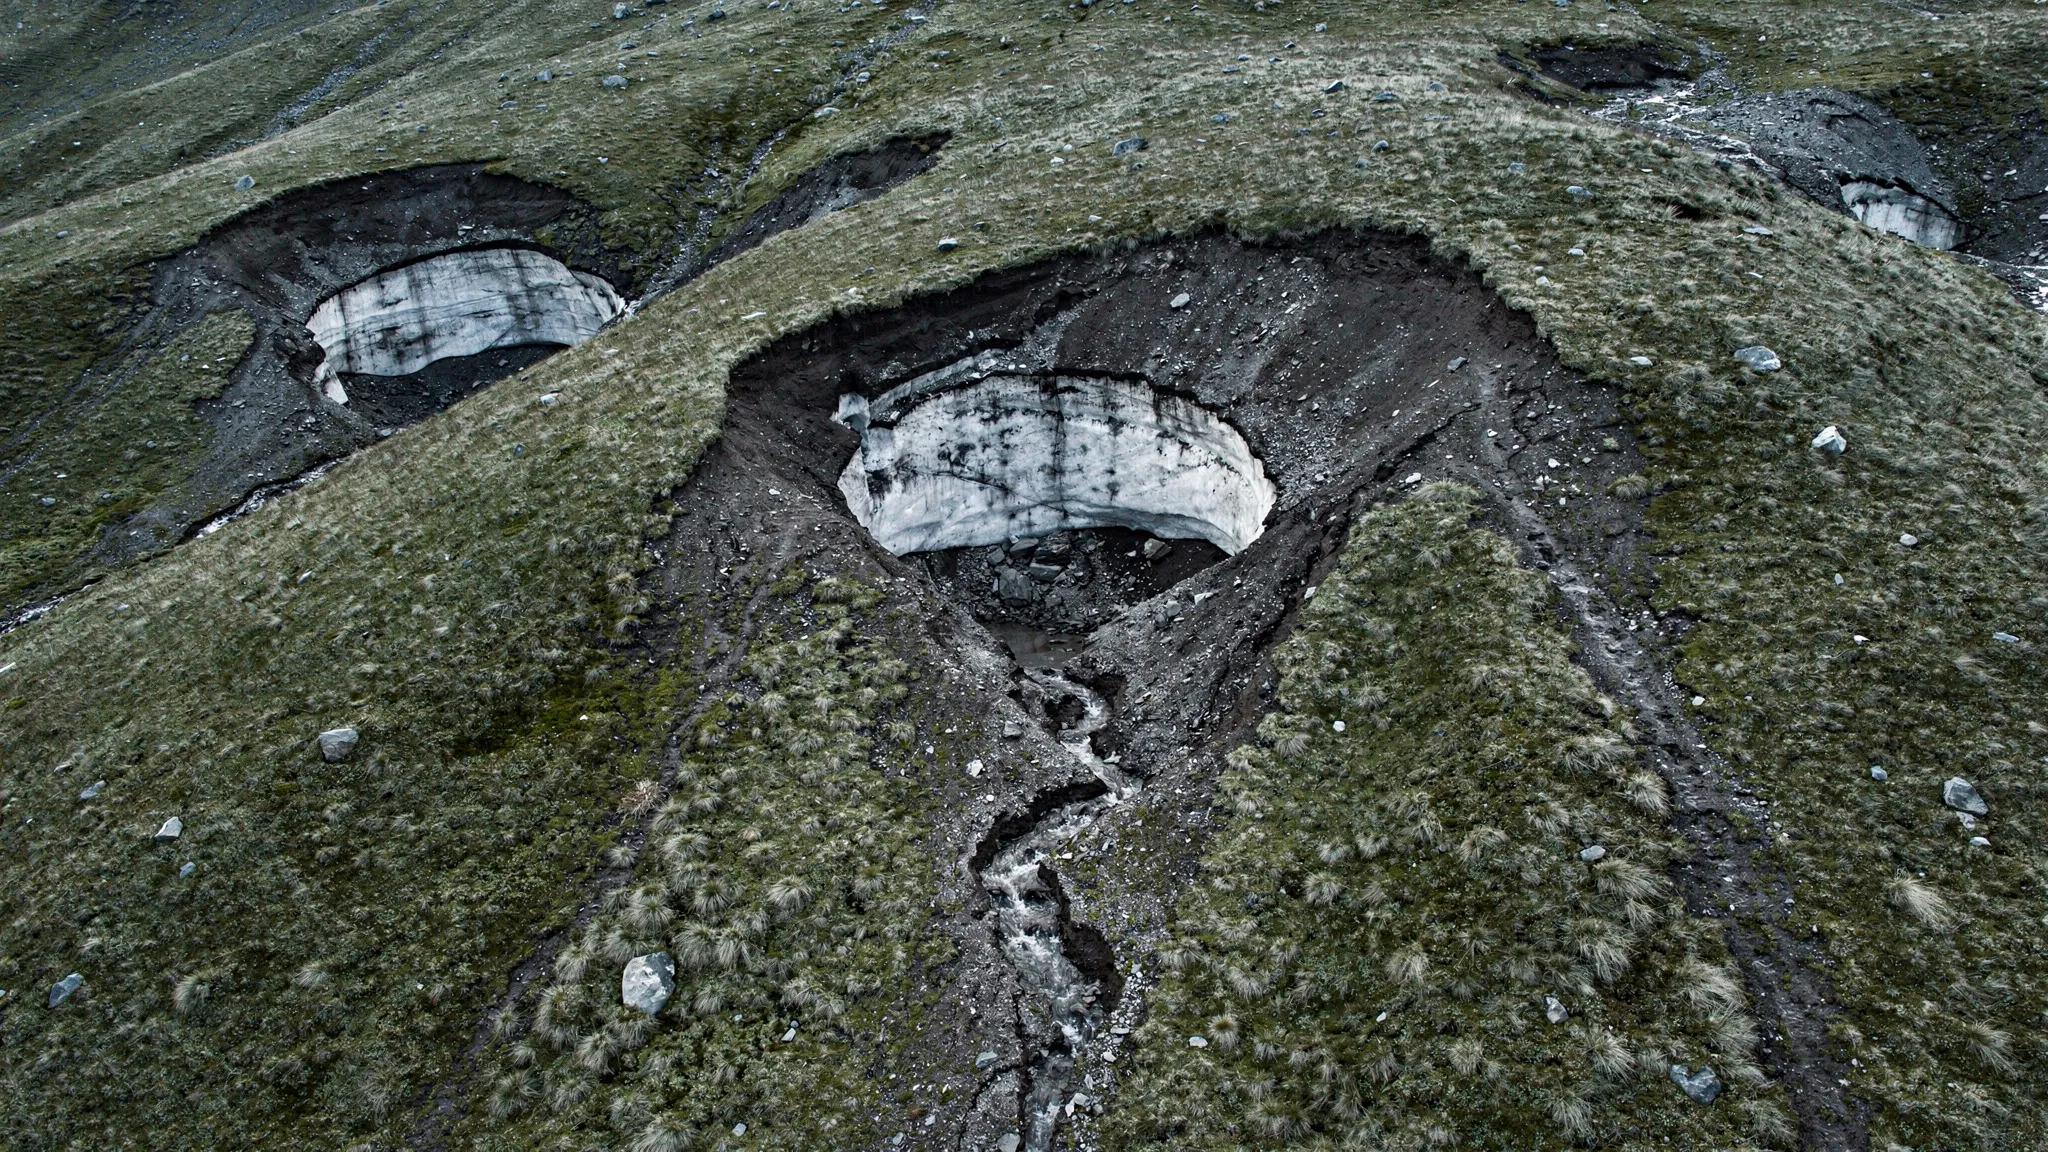
Permafrost — ground that stays frozen all year — is warming across the Tibetan Plateau, and the landscape is responding. One of its most dramatic responses is the retrogressive thaw slump. When ice-rich ground is exposed and thaws, the soil collapses, slides and flows downhill; the steep headwall then retreats upslope, and the scar grows year after year. These slumps can move large amounts of soil, sediment and organic carbon, and affect the rivers, water quality and vegetation below. Recent inventories show their number and activity rising on the plateau.
A selective collapse
The puzzle is where they appear. Warming is broad, but slumps are not. When the plateau is cut into 10 × 10 km squares, the top-ranked squares — just 0.17%, 0.69% and 1.20% of the area — hold 50%, 80% and 90% of all slumps in the inventory. Neighbouring slopes often behave completely differently.
No single factor explains this. Temperature, moisture, slope, ground ice and land cover all matter, but their effects are non-linear and vary from region to region. Yuting Yang, Gang Mei and colleagues at the China University of Geosciences in Beijing, with Chang’an University in Xi’an, propose to look at them together.
A map of weakness
Their tool is the Hillslope Weakening Field: a map of how weakened each hillslope is, relative to others in its region, given its combined thermal, moisture, soil, terrain, permafrost, ground-ice and land-cover conditions.
The study covers seven regions of the plateau, cut into 37,749 slope units — natural hillslopes from ridge to channel — and 2,672 slumps compiled from several published inventories. Fifty environmental variables are summarised for each unit. To avoid circular reasoning, every region is tested blind: its weakening map is built using only the other six regions, and its own slumps are used only afterwards, to check the result.
Clusters, in numbers
The slumps themselves are strongly clustered in all seven regions:
- Only 1,342 slope units out of 37,749 (3.56%) contain at least one slump.
- Distances between neighbouring slumps are just 27 to 40% of what chance would give.
- Pairs of adjacent slopes both carrying slumps are 4.35 to 12.12 times more common than chance.
- Clusters extend over 2.8 to 13.7 km.
The weakening map, built without the slumps, is itself spatially organised: weak slopes sit next to other weak slopes, over typical distances of 1.4 to 7.6 km, forming continuous high-weakening domains rather than isolated spots.
Where the slopes give way
The two patterns line up. Slopes with slumps have a median weakening score of 0.694, against 0.548 for slopes without. The link is positive in six of the seven regions and strong in five; in one region (R1), it is absent.
In those five regions, slumps become more concentrated as weakening increases. In the weakest 30% of slopes, slumps occur 2.27 to 2.76 times the regional background rate; in the weakest 10%, 3.35 to 5.09 times. Larger and more weakened domains are more likely to contain slumps. And around a slope that has slumped, the neighbours are also weaker than average, the contrast fading ring by ring over three rings of neighbours.
For the authors, this is how a broad warming turns into highly selective collapses: it is filtered by local conditions, and slumps gather where several unfavourable conditions overlap across connected stretches of land.
A map for watchers, not a forecast
A weak slope without a slump is not a mistake. The map describes long-term preconditioning; short-term triggers such as exposure of ground ice, erosion at the foot of a slope or unusual hot and wet events decide when a slump starts. Because the inventories lack dates, the study cannot separate the two.
Other limits: all seven regions are on the Tibetan Plateau; data on ground ice and the thawing layer are coarse; riverbank erosion, road works, rock type and extreme events are not yet included. Even so, the authors see a practical use: focusing field surveys, drone mapping and deformation monitoring on the most weakened, connected slopes — notably along roads and other infrastructure corridors that cross the plateau.