
THE DECADE BEFORE KAMCHATKA'S MAGNITUDE 8.8
On 29 July 2025, a magnitude 8.8 earthquake struck off the east coast of the Kamchatka Peninsula, where the Pacific plate dives beneath the Okhotsk plate. It ruptured a 500-kilometre stretch of the boundary between the plates — the largest earthquake recorded worldwide since the magnitude 9.1 Tohoku-oki earthquake of 2011, according to the study. The same segment had broken on 4 November 1952, in a magnitude 9.0 earthquake that sent a destructive tsunami across the Pacific.
Before a fault breaks, many lines of evidence suggest it goes through a preparatory phase: damage builds up, deformation concentrates, small earthquakes change character. Stanisław Lasocki, Beata Orlecka-Sikora and Mateusz Olszewski, of the Institute of Geophysics of the Polish Academy of Sciences in Warsaw, looked for that phase in the decade before the 2025 event.
Two numbers to read a swarm of earthquakes
The team uses two indicators that they developed in earlier work:
- dc, the “seismic regularity coefficient”: it measures how alike successive earthquakes are — in the time since the previous one, the distance from it, and their magnitude. A low dc means a more regular process, which they interpret as deformation concentrating on a single zone.
- SSD, the “seismic strain dynamics coefficient”: an estimate of how fast the rock is deforming.
According to their damage model, a dip in dc marks the moment when competing zones of deformation merge into one, the point after which cracks spread unstably. Then dc climbs again, and the big earthquake tends to arrive near its peak.
They applied this to an international catalogue: 2,682 earthquakes of magnitude 3.6 and above, from January 2014 to 20 July 2025, in a zone drawn around the fault. Their curves stop on 16 July 2025, before the final foreshocks and the main shock.
Seven episodes, two regimes
Between 2014 and 2025, the region produced seven episodes of strong earthquakes, among them a magnitude 7.5 in March 2020 near Paramushir Island, a magnitude 7.0 on 17 August 2024 near Petropavlovsk-Kamchatsky, and, on 20 July 2025, a magnitude 6.7 followed 20 minutes later by a magnitude 7.5. The magnitude 8.8 came nine days after that.
Before 2022, every episode was preceded by a deep dip in dc, often together with a dip in SSD. Then dc rose and the strong earthquakes struck near its maximum, between eight days and one year after the dip. For the 2020 magnitude 7.5, for instance, dc hit bottom on 12 June 2019 and peaked on the day of the quake, about nine months later.
After 2022, the picture changed. The dips became much shallower, riding on a long upward trend that continued until the great earthquake. The authors date a final turning point to March 2025, about five months before the main shock.
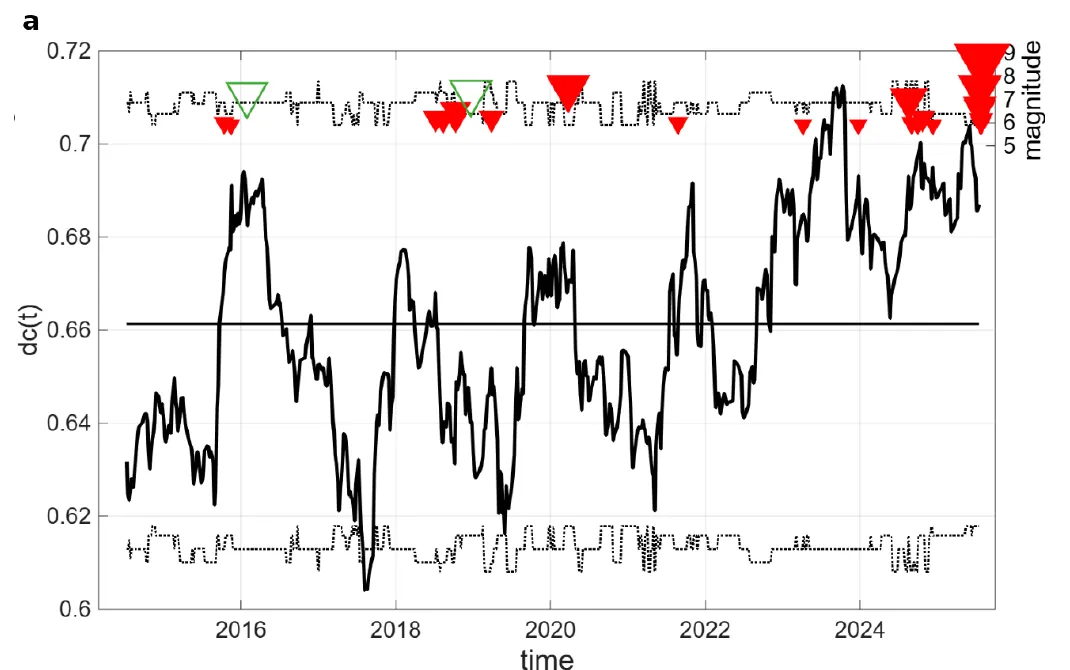
The regularity coefficient dc (computed after removing aftershocks): deep dips before 2022, then a rising trend up to July 2025. Red triangles mark earthquakes of magnitude 5.9 and above. — Figure 6a, Lasocki, Orlecka-Sikora & Olszewski (2026), arXiv:2610.13696.
Not one preparation, but two superimposed
The team’s reading: the record contains two processes at once.
- The cycles of 2014–2022 belong to other faults, mainly further south near Severo-Kurilsk, where nine strong earthquakes clustered. No quake of magnitude 5.9 or more occurred within 150 km of the future epicentre between 2014 and August 2024.
- From early 2022, the segment that would break in 2025 began behaving as one coupled system. The authors suggest that stress released by the southern earthquakes slowly spread northward as the deep, ductile layers beneath the crust flowed, and reached that segment about two years later.
This fits independent studies of the same area — based on background seismicity, satellite positioning and gravity — which describe the 2025 rupture zone as at least three distinct patches that broke together. The index adds a date: the moment the patches began to act together.
Another analysis of the same zone found that the rate of moderate earthquakes stayed steady until the last ten days before the main shock. The dc index, computed from the same earthquakes, shows a dated transition about three years earlier.
Hindsight, with caveats
The authors see “high potential for earthquake forecasting” in their indicators, which are already used to monitor the Colima region in Mexico in real time. But this study looks back at an earthquake that has already happened, and it evaluates the authors’ own indices, built on a theoretical model that is still an unpublished manuscript. They list further limits: the stress-transfer explanation rests only on an order-of-magnitude comparison borrowed from another earthquake, the match between patches is based on a visual comparison of published maps, and the two groups of earthquakes were drawn with fixed geographic boxes.