AI WEATHER MODELS TRACK CYCLONES BETTER, BUT STILL MAKE THEM TOO WEAK
Weather models trained on data now compete with the best physics-based forecasting systems on average, at a fraction of the computing cost. Whether that holds for rare, extreme events — the ones where a good forecast matters most — is contested. Earlier evaluations found serious failures on record-breaking weather and intense tropical cyclones, but they mostly tested deterministic models, which issue a single forecast. The newest models are probabilistic: they produce an ensemble of possible futures, each one a “member”.
Tropical cyclones make a demanding test. They are among the most damaging weather hazards, and evacuations depend on forecasts of their position and strength several days ahead, with an honest measure of uncertainty. Yet they occupy only about 0.5% of the grid points in global climate simulations.
178 storms, replayed
Nathan Chalumeau and colleagues — from INRIA, Sorbonne University and CNRS, and AXA in Paris — compared three AI models: GenCast, which samples future weather with a diffusion model; FourCastNet 3, released by NVIDIA; and FGN, which builds its ensemble from four separately trained networks. Their yardstick was IFS-ENS, the operational physics-based ensemble of the ECMWF, used as the numerical baseline.
They selected 178 cyclones that reached at least 64 knots of sustained wind, in every ocean basin, in two settings: 125 storms from 2021–2023 with models trained on the ERA5 reanalysis, and 53 storms from 2025 with operational versions fine-tuned on ECMWF’s high-resolution analyses. Each forecast ran 15 days with 49 or 50 members, starting 12 hours before the storm’s first wind report — 26,541 member forecasts in all. Rerunning the 2021–2023 forecasts took more than 6,000 hours of H100 graphics processors.
Scoring a cloud of possible positions
Forecast tracks are usually judged by the average position of the ensemble. The authors show why that can mislead with Typhoon Bualoi in 2025: the IFS-ENS members split into separate clusters that no average can represent.
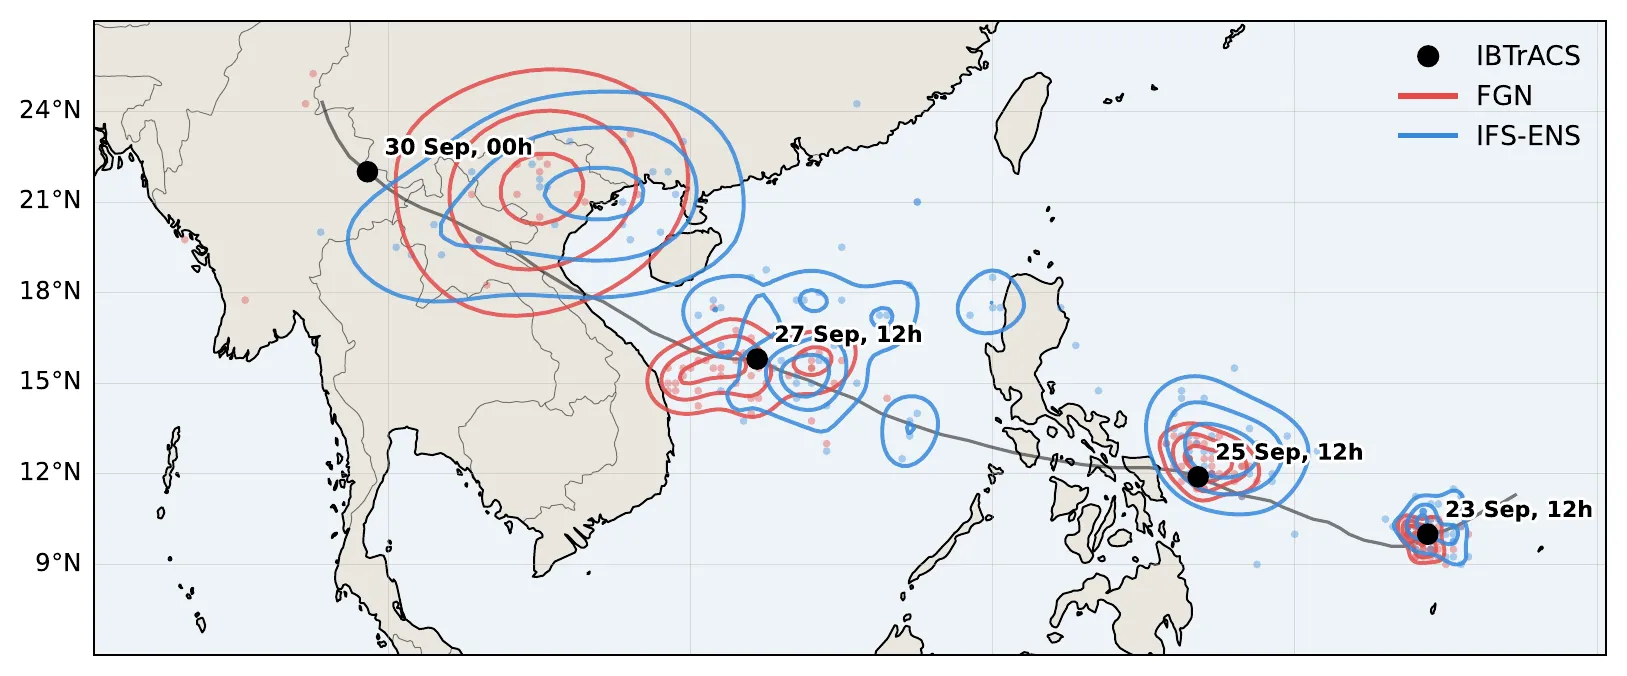
Typhoon Bualoi (2025): forecast positions from FGN (red) and IFS-ENS (blue) at four lead times, around the observed track (black dots). — Figure 2, Chalumeau et al. (2026), arXiv:2610.22077.
Instead, they turn each ensemble into a map of probability and ask how much of it lands on the storm’s observed position. Lower scores mean a better forecast.
On the 2021–2023 storms, GenCast beat IFS-ENS on 68% of cyclones and FourCastNet 3 did so on 58% — modest margins. On the 2025 storms, the gap widened: FGN beat IFS-ENS on about 90% of the 41 storms retained, and ranked first of the three models on 59% of them, against 34% for GenCast and 7% for IFS-ENS. FGN also had the best score on the full weather fields, and both AI models gained more over IFS-ENS around cyclones than across the globe. When the regions of strongest wind and lowest pressure were compared on their shape and position alone, the order stayed the same: FGN, then GenCast, then IFS-ENS.
Storms that are too gentle
Better placement did not mean better strength. On the 2025 storms, FGN and GenCast both underestimated peak winds at short and medium range, while IFS-ENS stayed within 10% of the reference. Fine-tuning on operational data had not removed this bias. In the earlier setting, GenCast had the better local score and yet the larger wind deficit. The ensembles were also poorly calibrated, with too little spread in places.
There is a twist. The AI storms are weaker, but the relationship between wind and pressure inside them looks right. Once each model’s intensity bias is removed by ranking, the correlation between maximum wind and minimum pressure is −0.83 for FGN and −0.84 for GenCast, against −0.88 for the high-resolution analysis and −0.87 for IFS-ENS. For FGN, trained one variable and one location at a time, that link was never imposed. It emerged anyway.
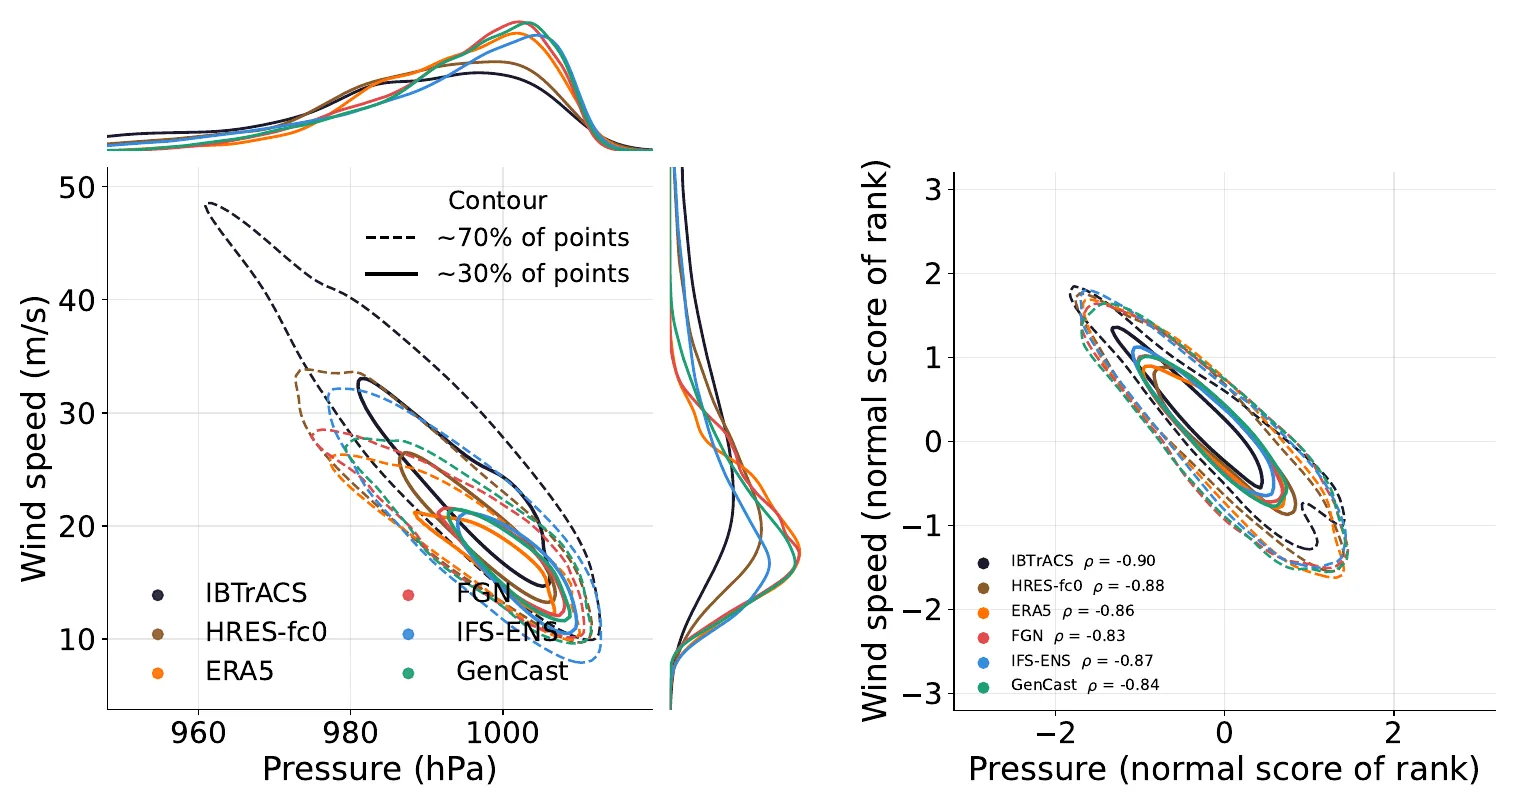
Left: the AI models’ storms have weaker winds and shallower pressure lows than the reference. Right: once ranked, every source follows nearly the same wind–pressure relationship. — Figure 6, Chalumeau et al. (2026), arXiv:2610.22077.
Not a warning system — yet
The authors draw a line under their own results. The study replays selected past storms; it does not include periods without cyclones, so it cannot judge whether the models raise false alarms. The two settings differ in storms, model versions and even IFS-ENS upgrades, so the effect of fine-tuning cannot be isolated. And the ethics statement is blunt: these results “should not be read as guidance on using any of these models for operational warnings.”
Their conclusion is a to-do list. Correct the intensity, design training targets that weigh extreme winds, improve the uncertainty — and check each time that the gains in position and in the wind–pressure link survive.