এখনও অনুবাদ হয়নি: মূল ইংরেজি সংস্করণ।
HOW MANY CARDS UNTIL THE FIRST ACE?
The puzzle comes from a long series of brain-teasers written by Professor Jostein Lillestøl for Tilfeldig Gang — a play on words meaning “Random Walk” — the magazine of the Norwegian Statistical Association: “Take a deck of 52 cards, including its 4 aces. Shuffle well, then turn over one card at a time until the first ace appears. How many cards are needed on average? Challenge: find different solutions.”
Nils Lid Hjort, a statistician at the University of Oslo, says he spent two summer days on his balcony on it — without AI. His short essay opens with a lament: he believes an AI will soon be able to write such an essay “in the occasionally flowery literary style of Professor N.L. Hjort”, which he finds “spellbindingly splendid — and yet, troubling and worrisome.”
The answer: 10.6
With N cards including n aces, the average number of cards needed to reach the first ace is:
(N + 1) / (n + 1)
For an ordinary deck: 53 / 5 = 10.6.
Hjort proves it in several ways:
- By computing the exact probability that the first ace appears on each draw, then averaging, with the help of a classic identity from Pascal’s triangle. Sum the numbers along a diagonal and the answer appears one step further down, on the next row — for instance 1 + 4 + 10 + 20 = 35. It is nicknamed the “Christmas stocking” or “hockey stick” formula.
- By adding up the probabilities that no ace has appeared yet.
- With a smooth approximation: for a large deck, the waiting time divided by N + 1 behaves like a known curve (a Beta distribution), whose average gives the same result.
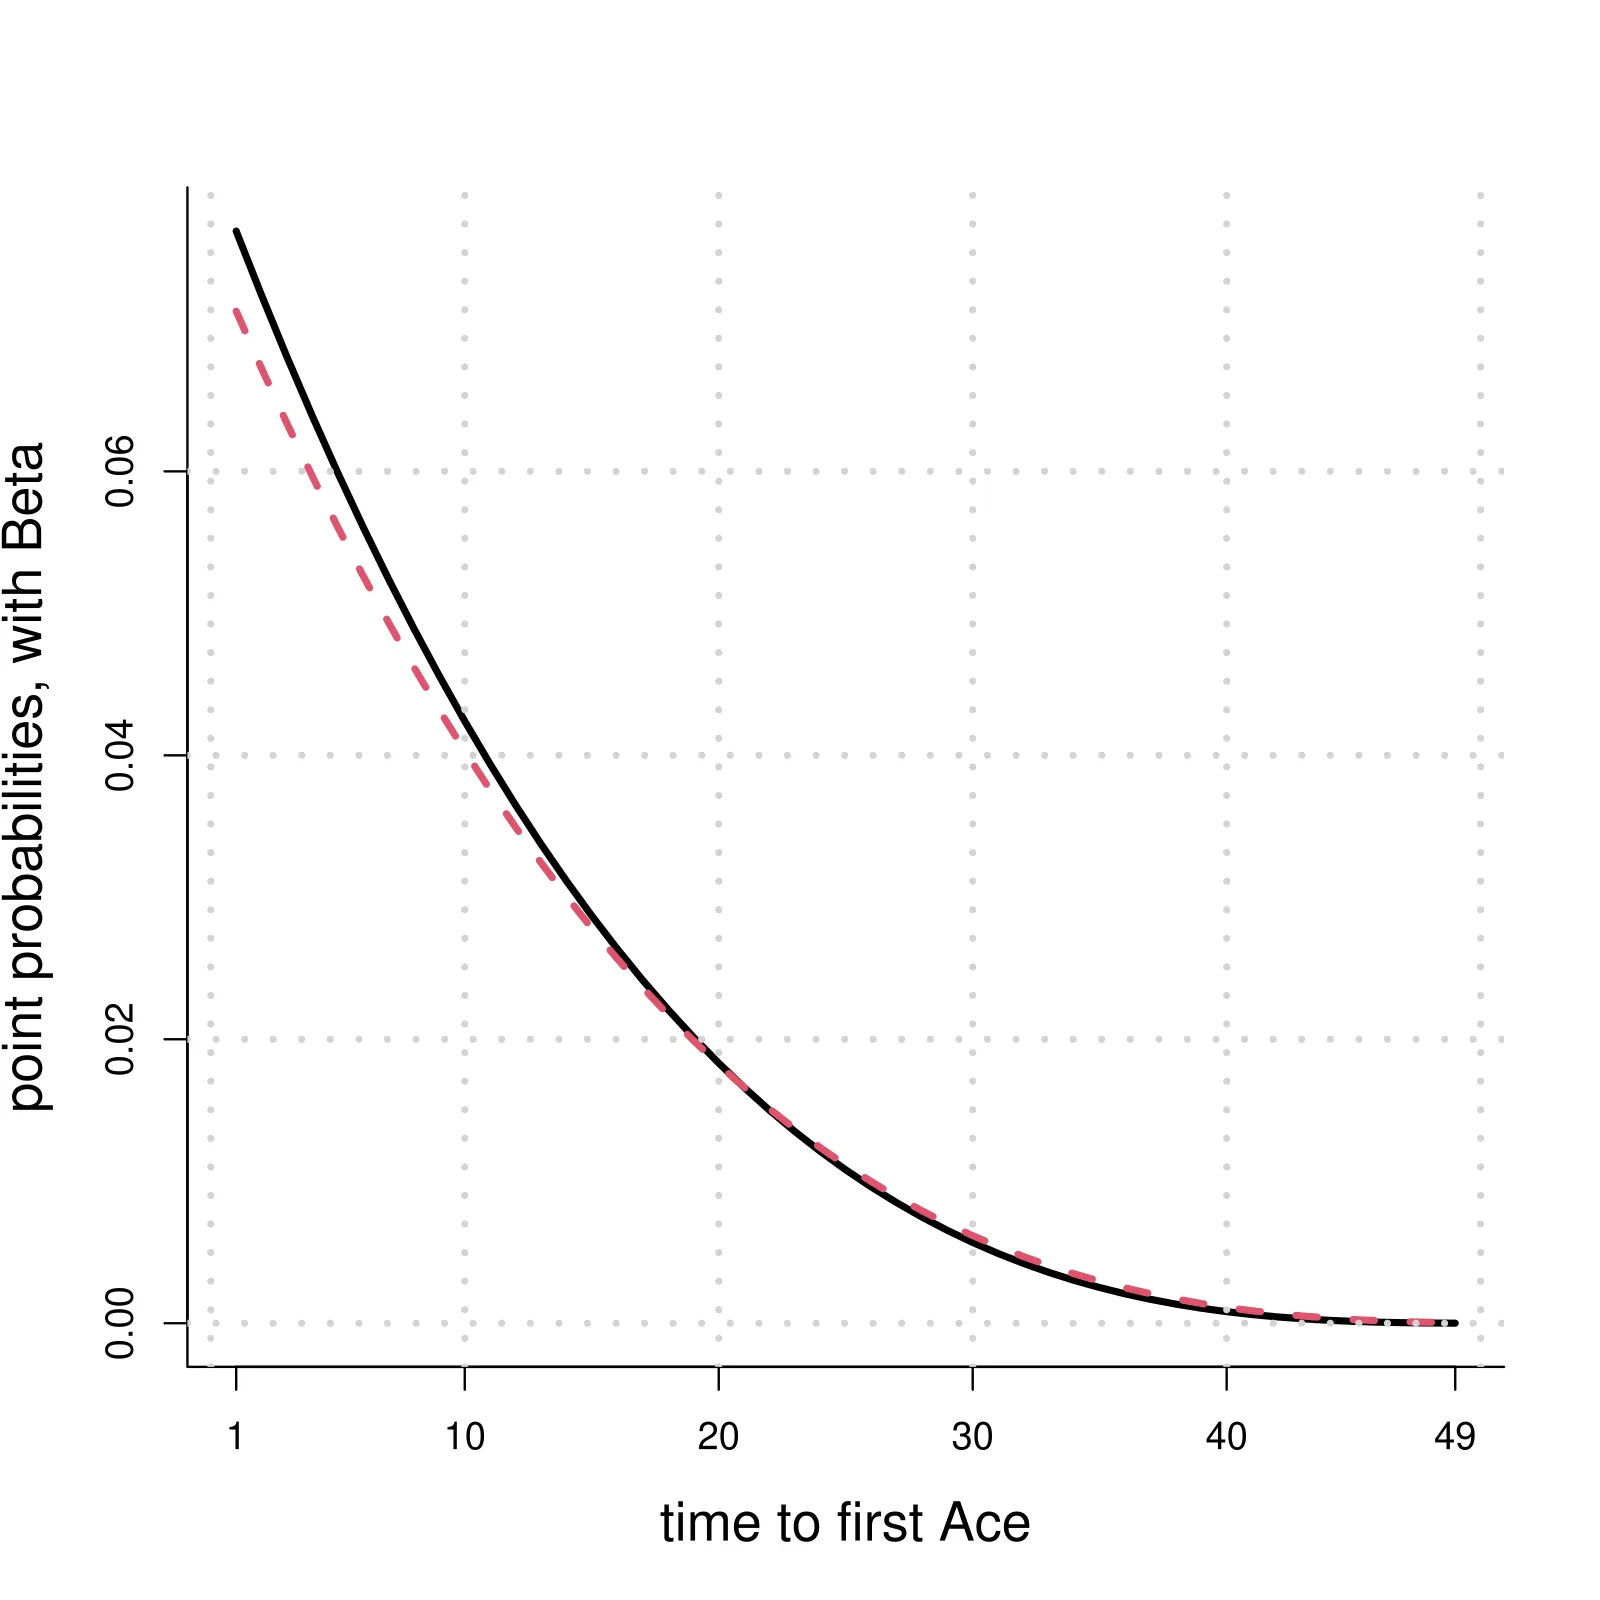
Chance that the first ace shows up on each draw: exact (black) and approximation (red, dashed) almost coincide. — Figure 1, Hjort (2026), arXiv:2609.29596.
The other aces
The gap between the first and second ace, between the second and the third, and so on, all follow the same distribution as the wait for the first ace. They are not independent, but interchangeable. On average, the four aces therefore cut the 53 “slots” of the deck into five equal parts. For large decks, the positions of the aces behave like points dropped at random on a line — a link to more advanced tools of modern statistics.
Turning the puzzle around
The useful part comes when you reverse the question. Suppose you do not know how many cards — or people, or animals — there are.
- You know there are 4 aces, and the first one appears on the 10th card. The best estimate of the deck size is 58, with a wide margin of uncertainty.
- There are 1,000 people in a room. You greet them one by one, and the first five left-handers you meet are numbers 10, 18, 22, 39 and 50. Estimate: about 85 left-handers, with a 90% confidence interval from 33 to 172. Only the position of the fifth one actually matters.
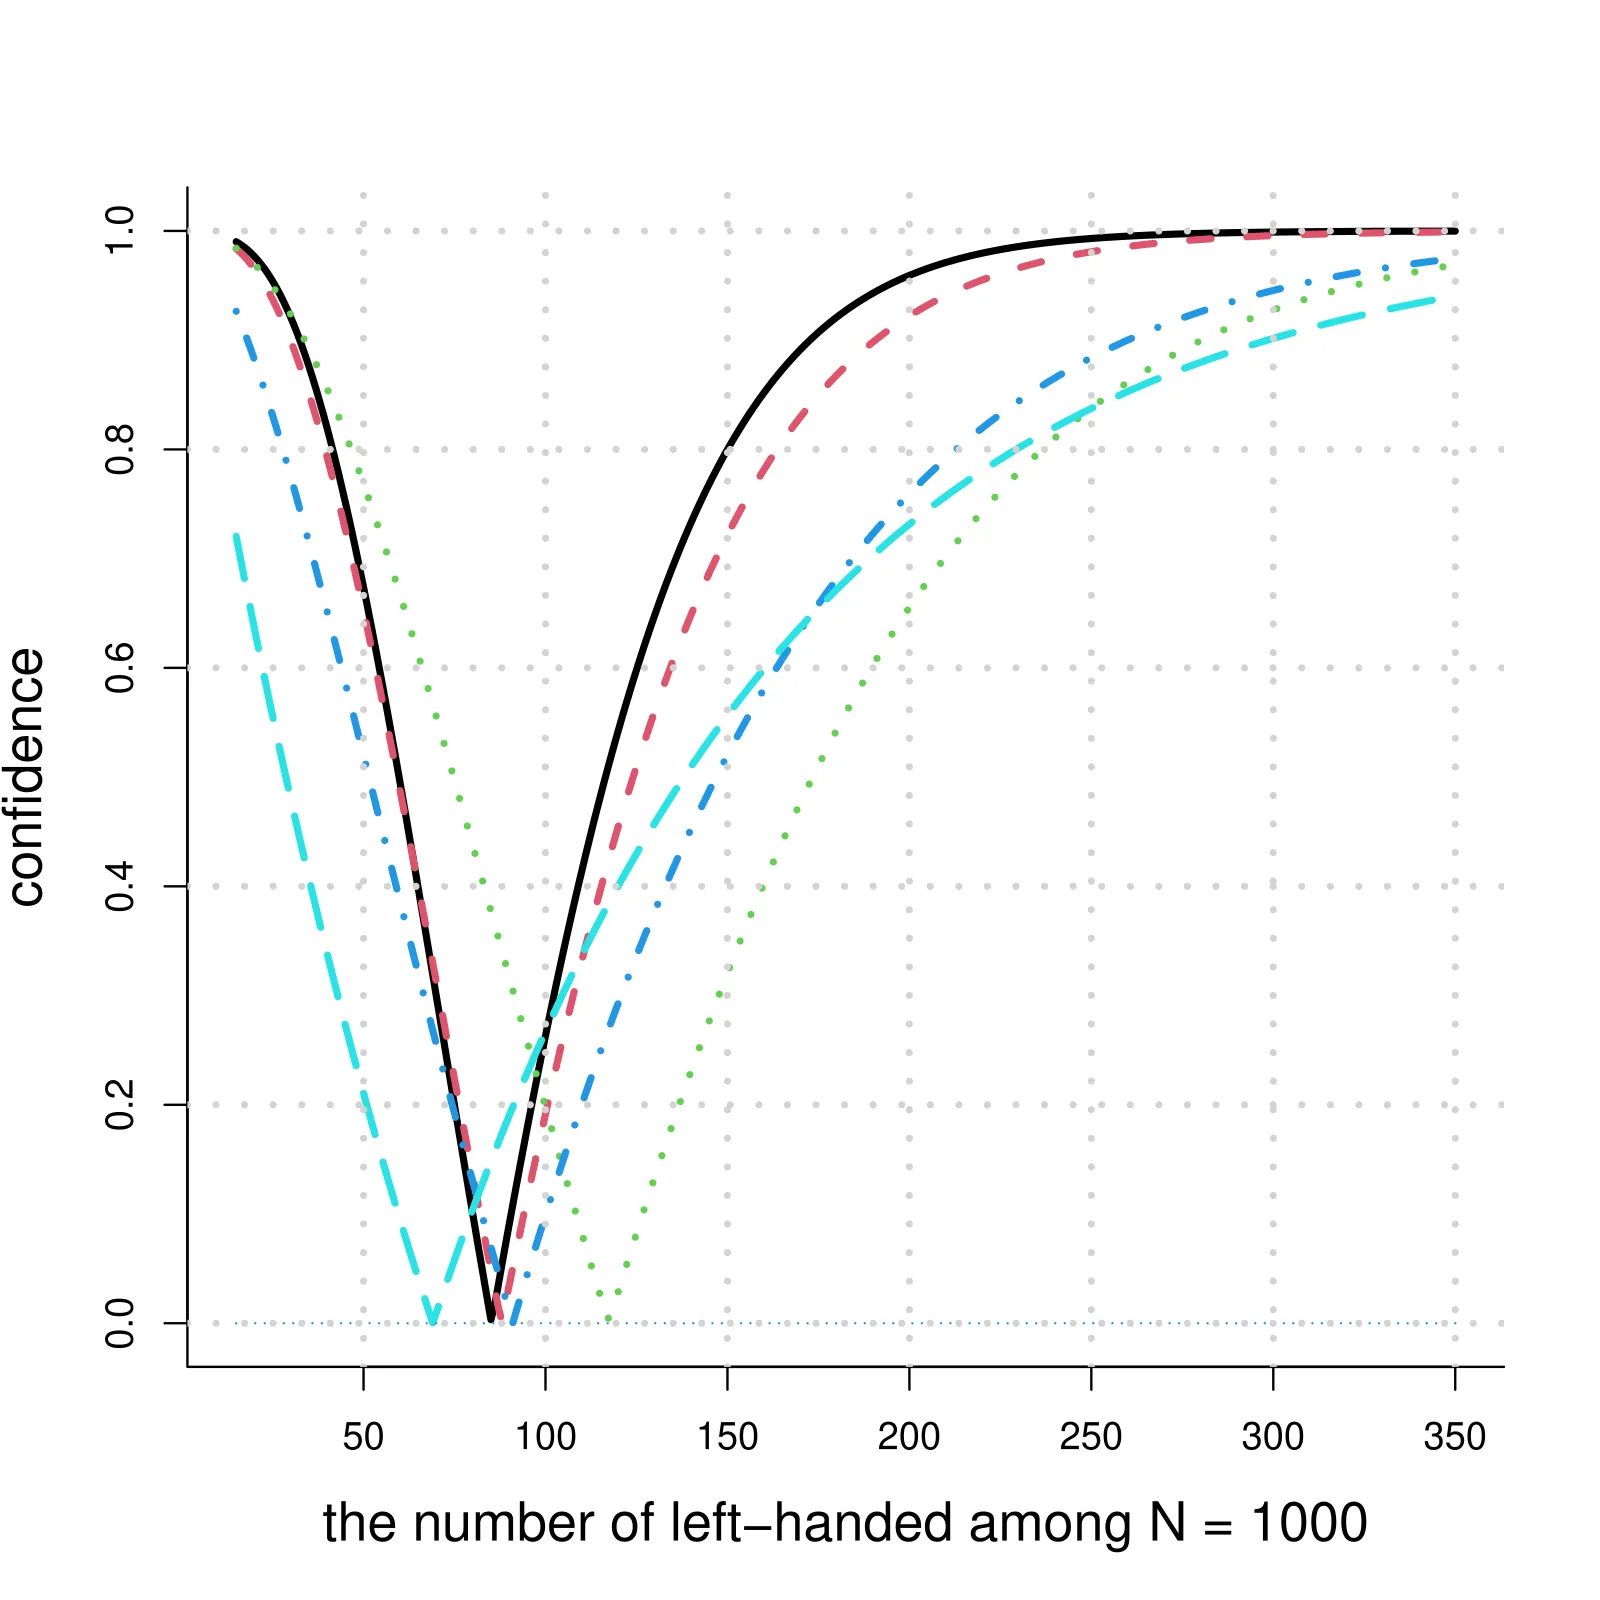
Estimating the number of left-handers among 1,000 people: each new left-hander found sharpens the estimate (black curve: all five). — Figure 3, Hjort (2026), arXiv:2609.29596.
Hjort points to real uses of such reasoning, “counting the uncounted”, in his book of statistical stories: estimating numbers of voles or deer in a forest, and the number of people killed in Guatemala between 1978 and 1995.