TWO RANDOM PATHS THAT LOOK LINKED
In 1926, Yule noticed something troubling: completely independent time series can show large correlations. Yule called it “nonsense correlation”. Those experiments with random walks — sequences built by adding random steps one after another — showed correlations far more scattered than independent samples would suggest. Later work proved that these spurious correlations do not go away when the series get longer.
Liping Zhu and Zhongming Xie, at the Institute of Statistics and Big Data of Renmin University of China, asked whether the problem survives a more modern tool.
A measure that should not be fooled
Ordinary (Pearson) correlation only detects straight-line relationships. Distance correlation, described by Székely and colleagues in 2007, is more ambitious: for two random variables, it is zero if and only if they are independent, whatever the shape of their link. It always lies between 0 and 1.
But that guarantee assumes the data are independent draws. A pair of random walks is different. Each step affects every later value of the walk, so successive observations share their past, and their spread keeps changing over time. Simulations had already shown large distance correlations between independent random walks, which earlier authors put down to the walks’ serial dependence and changing spread; what was missing was a theory of their limit.
A limit strictly between 0 and 1
The authors prove that, as the walks get longer, the distance correlation does not shrink to zero. For any walks whose steps are independent, drawn by the same rule and not too wildly spread (finite variance), it converges to a random value given by two Brownian paths, the continuous limit of random walks. That limit is universal — it does not depend on how the steps are distributed — and lies strictly between 0 and 1, taking values all across that range. So the chance of seeing a correlation above any threshold you like, say 0.3, never vanishes.
The key is to see one pair of walks as a cloud of points: pick a moment at random, note where both walks are at that moment, and repeat. The cloud records how much time the pair spends in each region. Two walks can be generated with no influence on each other, yet one particular pair, followed through time, still traces a cloud with a clear shape, and that shape is what distance correlation picks up.
Simulations: stuck at 0.5
The team simulated 2,000 pairs of independent walks with Gaussian steps for each length from 50 to 5,000 steps. For the steps themselves, the distance correlation fades as expected: from 0.244 at 50 to 0.025 at 5,000. For the walks built from those very same steps, it stays at about 0.5 at every length.
At 5,000 steps, the middle 90% of walk pairs spread from 0.215 to 0.844, and 1,644 of the 2,000 pairs — 82% — exceeded 0.3. The authors stress that the value near 0.5 is an empirical finding, not a proven constant.
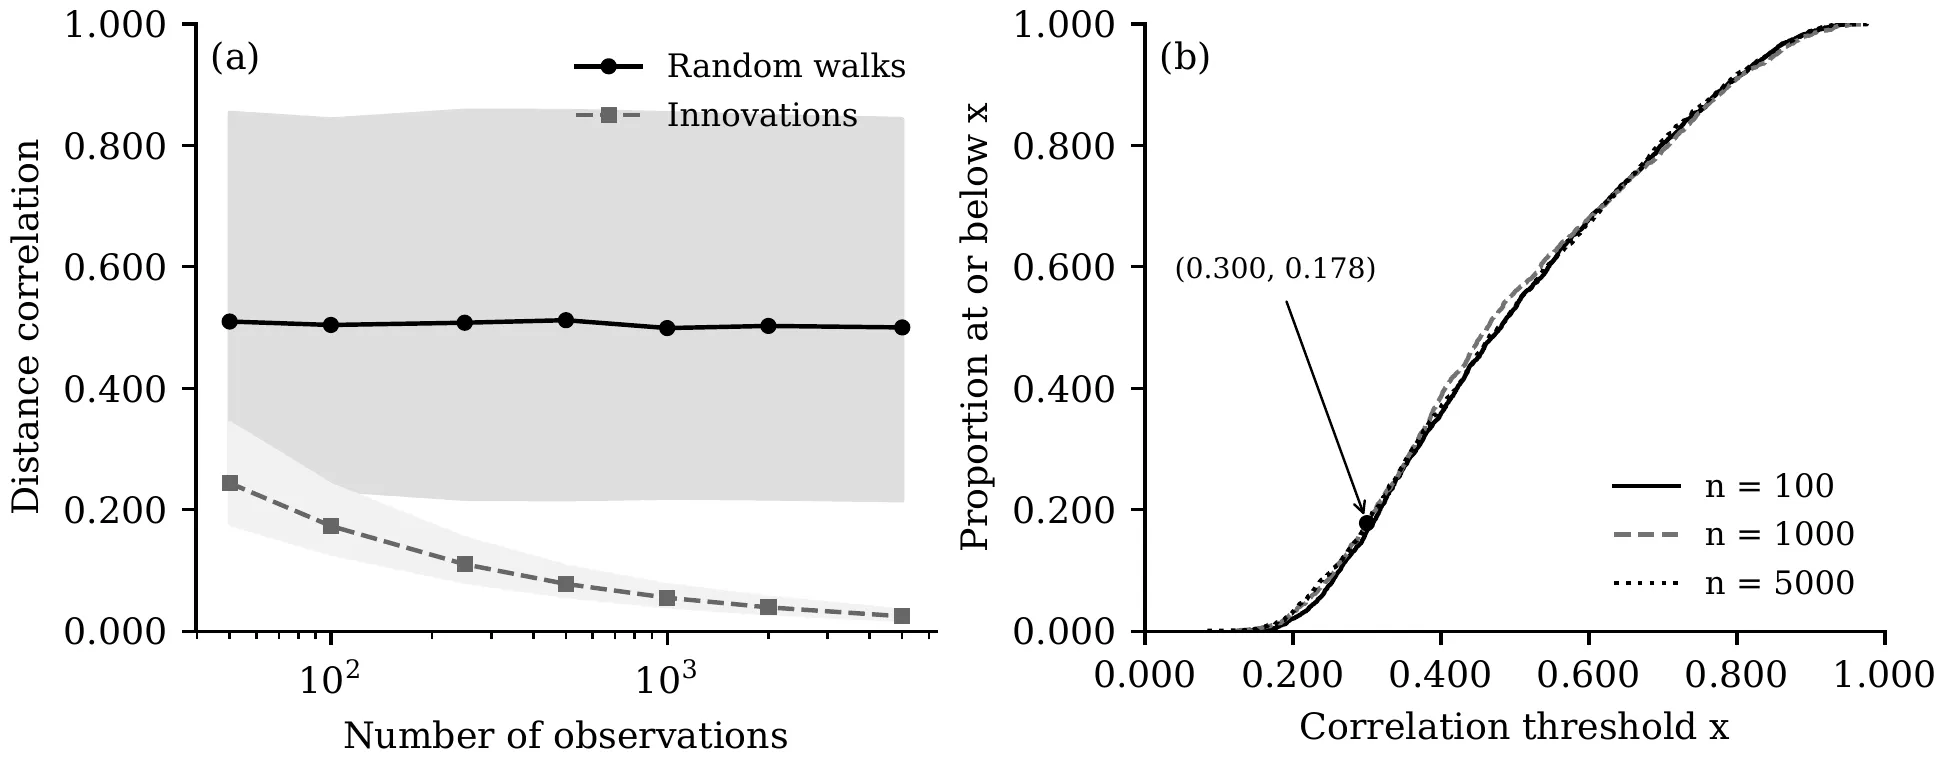
(a) Mean distance correlation for random walks (solid line) and for their independent steps (dashed), with 5–95% bands, against the number of observations. (b) Share of walk pairs whose correlation is at or below each threshold, for 100, 1,000 and 5,000 steps; the marked point shows that 17.8% of them do not exceed 0.3 at 5,000 steps. — Figure 1, Zhu & Xie (2026), arXiv:2611.16614.
The test that always cries wolf
The standard way to test independence with distance correlation is to shuffle: scramble the time order of one series many times and see whether the real value stands out. The authors prove that for random walks, this test rejects independence with a probability tending to 1, whatever the error level chosen.
The simulations agree. At the usual 5% level, the shuffling test wrongly declared a link for 94% of independent walk pairs of 100 steps, and for all 300 pairs of 500 and of 2,000 steps. For the independent steps themselves, it erred about 5% of the time, as it should. Shuffling destroys the time order that the walks carry, so it builds a reference that does not describe independent walks.
Levels or steps?
The study also computes one exact number: for very long walks, the average of the squared distance covariance, the raw top of the distance-correlation fraction before it is scaled, is 26/(75π) − 1/12, about 0.0270. The simulations match it to within about one unit of their own statistical uncertainty.
The authors draw a careful lesson. Asking whether two processes are dependent is not the same as asking whether one observed pair of paths is associated over time. Taking differences between successive values recovers independent steps, but then the test is about the steps, not the levels — a different question. A valid test for drifting, non-stationary data must build their dependence through time into its reference, and building one is a separate problem that this paper does not solve.