THE MAY 2024 AURORAS, MAPPED BY 696 ORDINARY WITNESSES
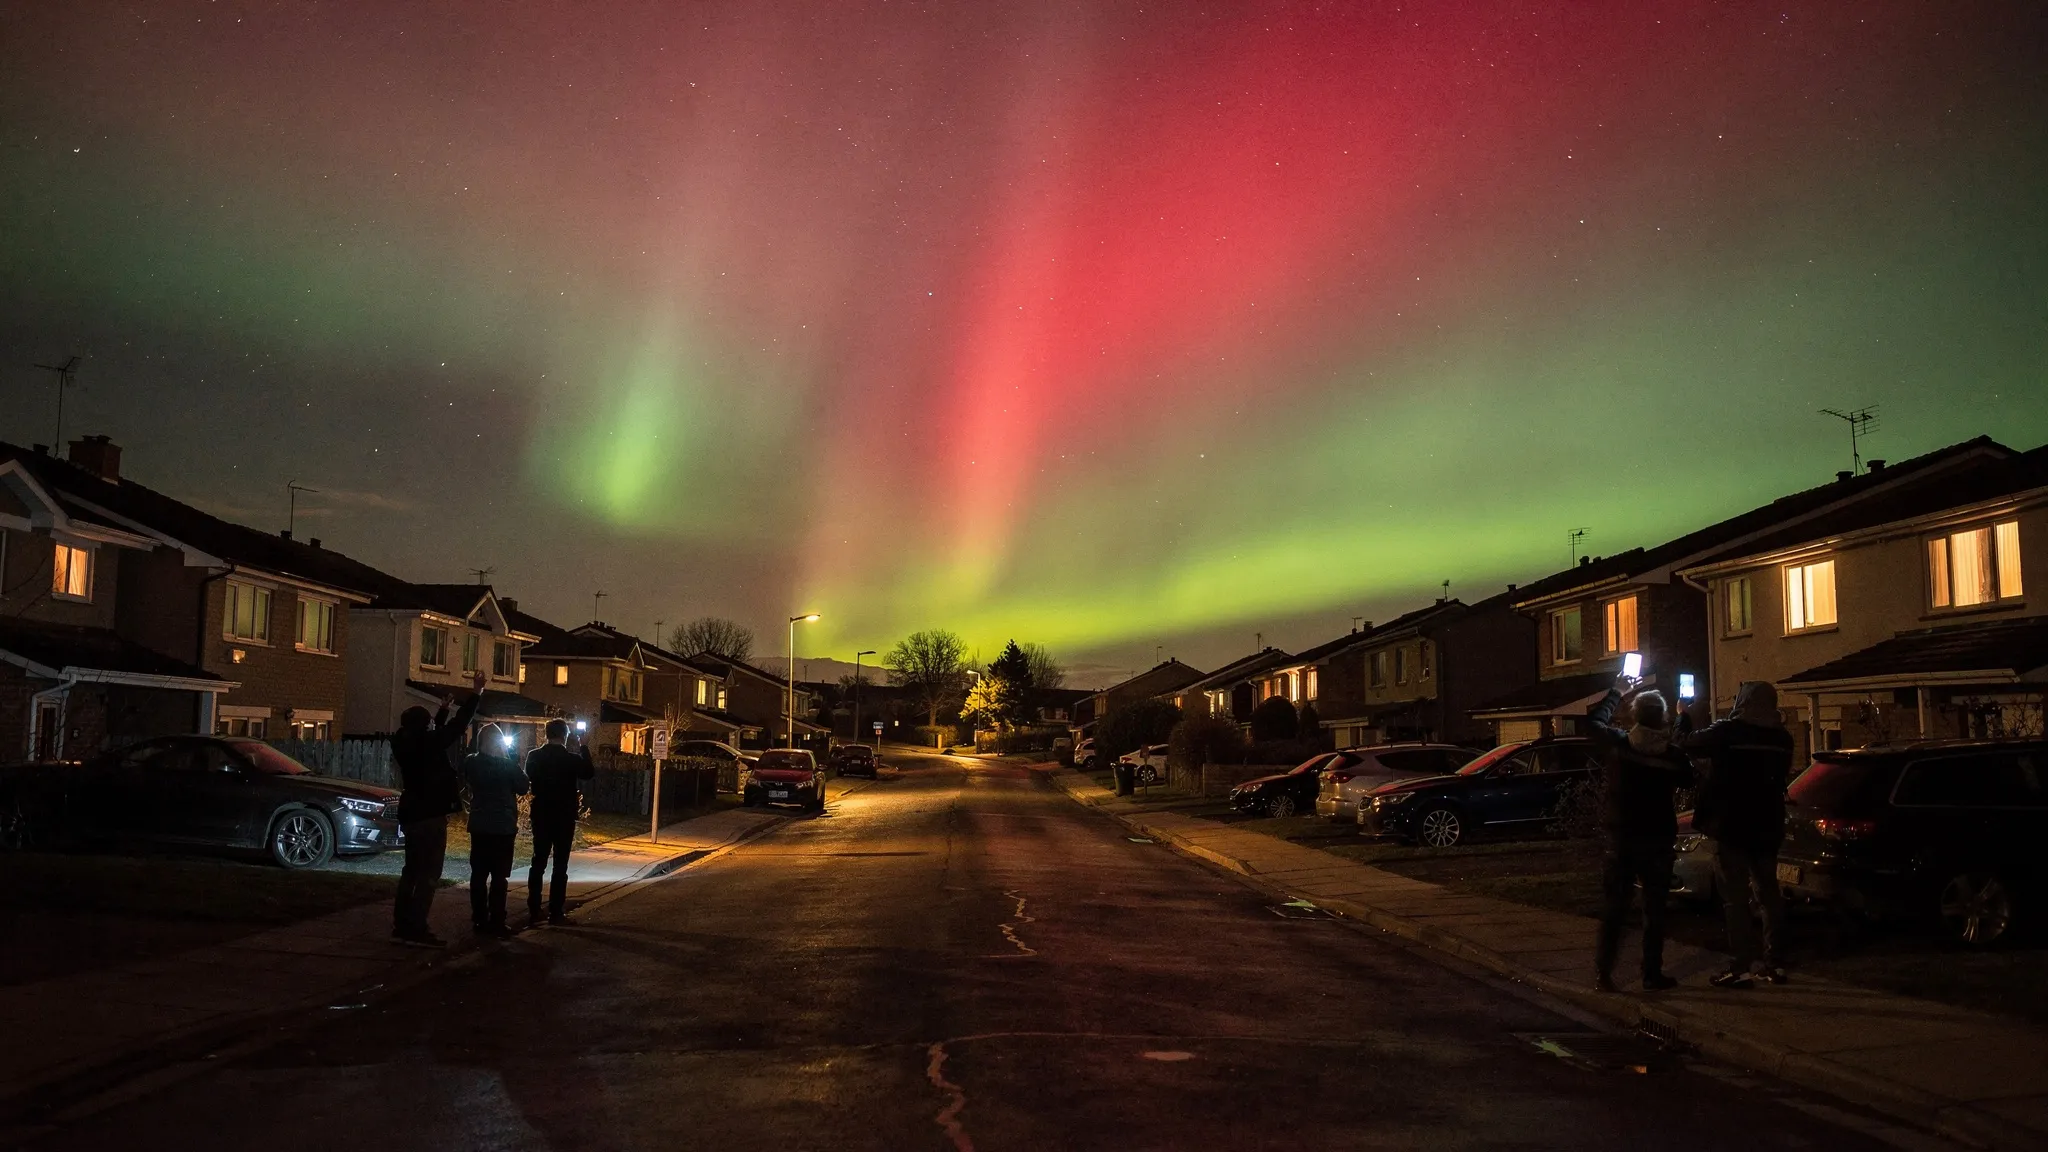
Auroras normally stay close to the poles. During geomagnetic storms, they slide towards the equator. The storm that began on 10 May 2024 was the most intense since the “Halloween storms” of October–November 2003, more than 20 years earlier. It came from several clouds of solar plasma, coronal mass ejections, launched from a cluster of sunspots sixteen times the diameter of Earth. The authors call it the Gannon Storm, in memory of Dr Jennifer Gannon.
Blind spots in the science
Such storms push the auroral oval beyond the regions where most auroral instruments sit. Models struggle too: one standard model of the auroral oval was fitted for conditions up to a Kp index of 8+, and during this storm Kp reached 9 in three separate three-hour periods. And because the storm came less than a month and a half before the northern summer solstice, many optical instruments in the far north were switched off, the sky not being dark enough.
The numbers show how extreme it was. The SuperMAG index of auroral currents jumped from under 200 to over 800 nanoteslas in two minutes and peaked at 4,276 nT. Between late 2003 and the end of 2023, it had topped 4,000 nT only seven times. The ring-current index fell to −427 nT; in those twenty years, it had gone below −300 only once.
696 reports from over 30 countries
At the same time, millions of people had been alerted by news outlets and social media, and modern phones can photograph auroras. Maxime Grandin of the University of Helsinki and the Finnish Meteorological Institute, with fourteen co-authors — three of them citizen scientists — set up an online form through the ARCTICS working group of the International Space Science Institute in Bern. Between 18 May and 24 June 2024, it gathered 696 reports from over 30 countries: where and when people saw the aurora, its colours and shapes, and any trouble with GPS, networks or power. The team added 186 observations from Skywarden, a moderated Finnish catalogue.
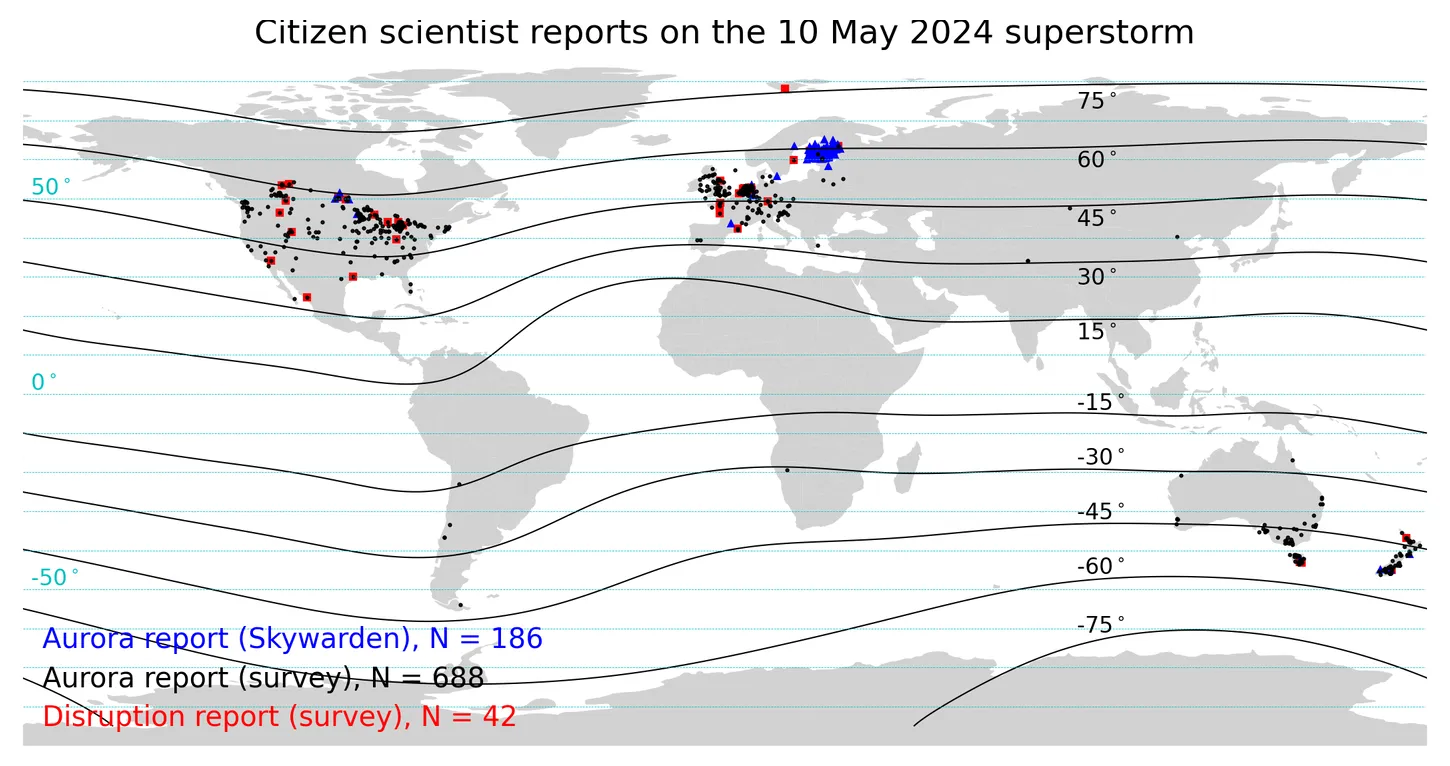
Where the reports came from: aurora sightings from the survey (black) and Skywarden (blue), technological disruptions (red), with curves of geomagnetic latitude. — Figure 2, Grandin et al. (2026), arXiv:2610.19929.
Far closer to the equator
Most sightings came from between 40° and 60° of geomagnetic latitude, with a few from even lower. The most extreme report, from San Pedro de Atacama in Chile at −14.5°, was probably an unusually bright glow of the upper atmosphere rather than a true aurora. Even so, the authors conclude that the aurora reached much closer to the equator than auroral oval models predict. The official definition of the most extreme storm category says auroras are typically seen down to about 40°.
The witnesses’ positions are not exactly where the aurora shone: seen low on the horizon, a red glow at 250 km altitude could lie hundreds of kilometres away. The authors put the uncertainty at up to ±11.5° for red and ±6.7° for green. Still, it is one of the few measurements of the oval’s edge during such an event.
Red and pink, to the naked eye
All four auroral colours — red, green, blue and pink-purple — were reported by eye, not only in photos. That alone says the displays were exceptionally bright, since the eye usually cannot tell colours in a faint aurora, and is particularly poor at seeing red. Green was seen down to about 38° and photographed down to about 35°, which is very unusual: at mid-latitudes, one normally sees mostly high red emissions.
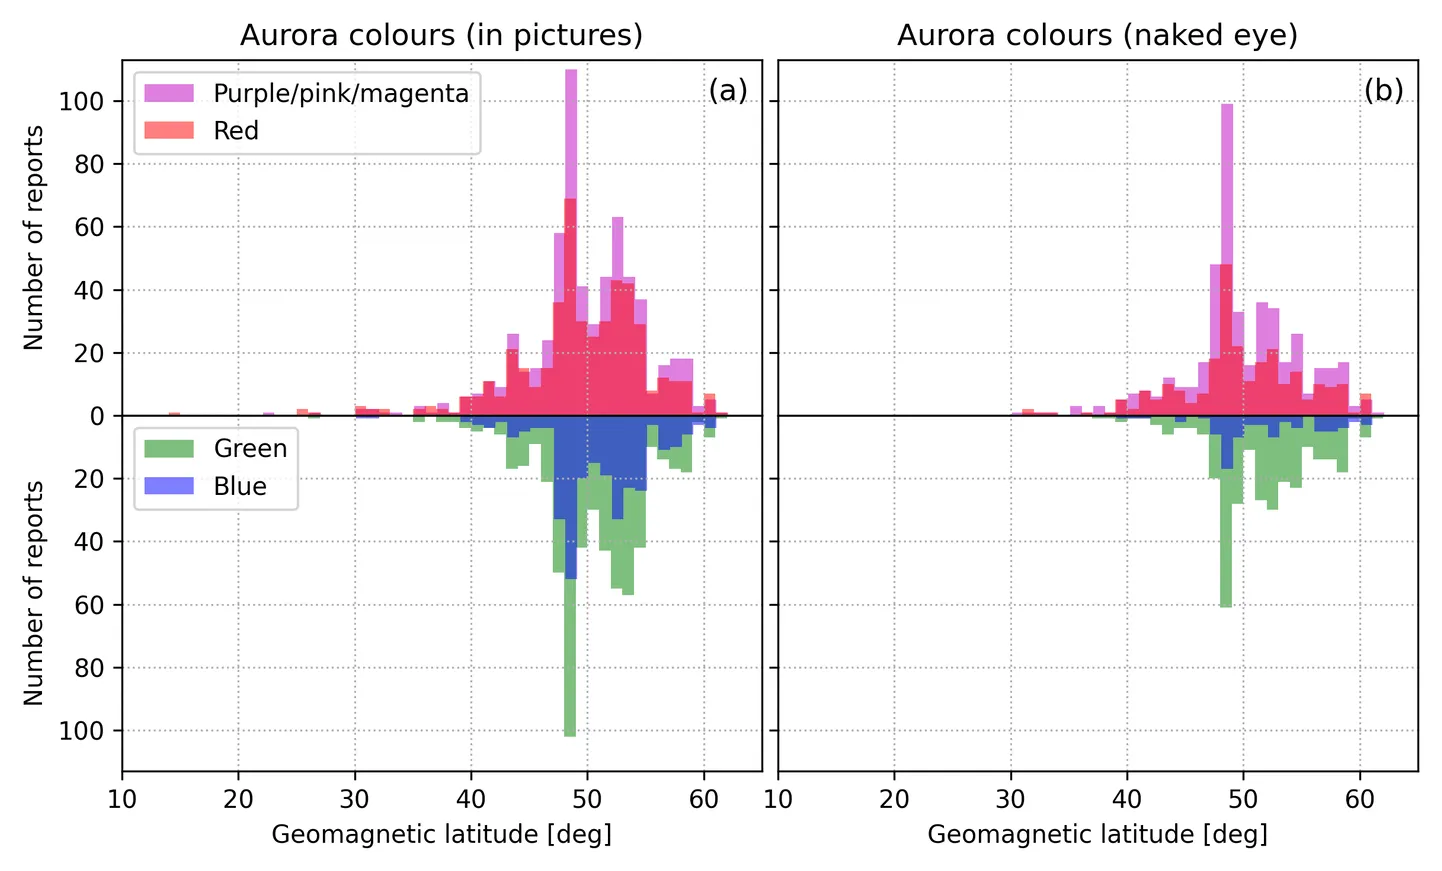
Colours reported in photos (left) and seen with the naked eye (right) as a function of geomagnetic latitude. — Figure 5, Grandin et al. (2026), arXiv:2610.19929.
The dominance of red and pink tells something about what was raining down from space. Intense red aurora points to large numbers of low-energy electrons, below 1 kiloelectronvolt, depositing their energy above about 200 km. Most of the blue and pink reports came while the Sun was less than 24° below the horizon, when the top of the atmosphere is still sunlit and nitrogen ions scatter sunlight in blue, which looks pink or purple against a not-quite-dark sky.
GPS glitches and sinking satellites
Only 42 people reported technical trouble: mostly geolocation problems (22), then network issues, unstable power and a few power cuts. Their timing matched two drops in the storm index, though with so few reports the match could be chance. Public orbit data told a clearer story: during the storm, four satellites lost extra altitude from the swollen upper atmosphere — 256 metres for the International Space Station, up to about 2 kilometres for the lowest one.
A better form for the next storm
The study has its limits. Data were collected after the fact, with a basic form; questions on auroral shapes proved too technical for many first-time watchers; reports came mostly from Europe, North America and Oceania. The authors call for clearer guides, structured platforms like Skywarden, and analysis of the photos themselves, whose red-green-blue balance could reveal the energy of the incoming electrons. No major power outage or spacecraft loss was reported this time — probably, they suggest, because the incoming particles were mostly of low energy. The next superstorm may not be so gentle.