CITIES SIT WHERE CLIMBING COSTS THE LEAST
Climbing a slope costs energy, and in a city that cost never stops: it comes back every time a route is used, by everyone who uses it. Routes of similar length can involve very different amounts of it. Federico Bellisardi and José Ramasco, at the IFISC institute (CSIC-UIB) in Palma de Mallorca, with Enrique Cano Suñén of the University of Zaragoza and Ana Ruiz-Varona of San Jorge University, asked a simple question about it. Does a real city need less energy to get around than the same city placed differently on the same terrain?
Moving a city around its own landscape
The team built three ingredients for each city. Trips: origin-destination flows between cells of about a kilometre, inferred from geolocated Twitter/X data from 2015 to 2022, keeping only users present in the city for at least two months to capture routine movement. Streets: the road network from OpenStreetMap. Terrain: elevation from NASA’s Shuttle Radar Topography Mission, at about 90-metre resolution.
Each trip follows the shortest route in three dimensions, and its energy has two parts: one proportional to distance, and one for every metre of climbing — downhill stretches do not pay back the climbs. The paper writes it as
W = λL + mg ∫ max(0, dh/dℓ) dℓ
with values typical of a private car (λ = 585 joules per metre, a mass of 1,200 kg), kept identical for every version of a city.
Then comes the experiment. The street network is shifted by steps of 250 metres up to 2.5 km in each direction, rotated by 1 to 40 degrees, and stretched by 2 to 20%, while the trips stay the same. Any version that puts a street in the sea, a lake or outside the elevation data is discarded. The energy is recomputed for each one.
Madrid at the bottom of the curve
Climbing is concentrated: about 10% of street segments carry more than 60% of all the uphill work, along corridors where steep slopes meet heavy traffic. That is why small moves matter so much: shift a network a little, and many trips land on, or off, a few steep corridors.
In Madrid and in Santiago de Chile, every shift and every rotation tested raises the total energy; the real city sits at the minimum. In Santiago, the highest mountains lie to the east and north, and moving the city that way costs the most.
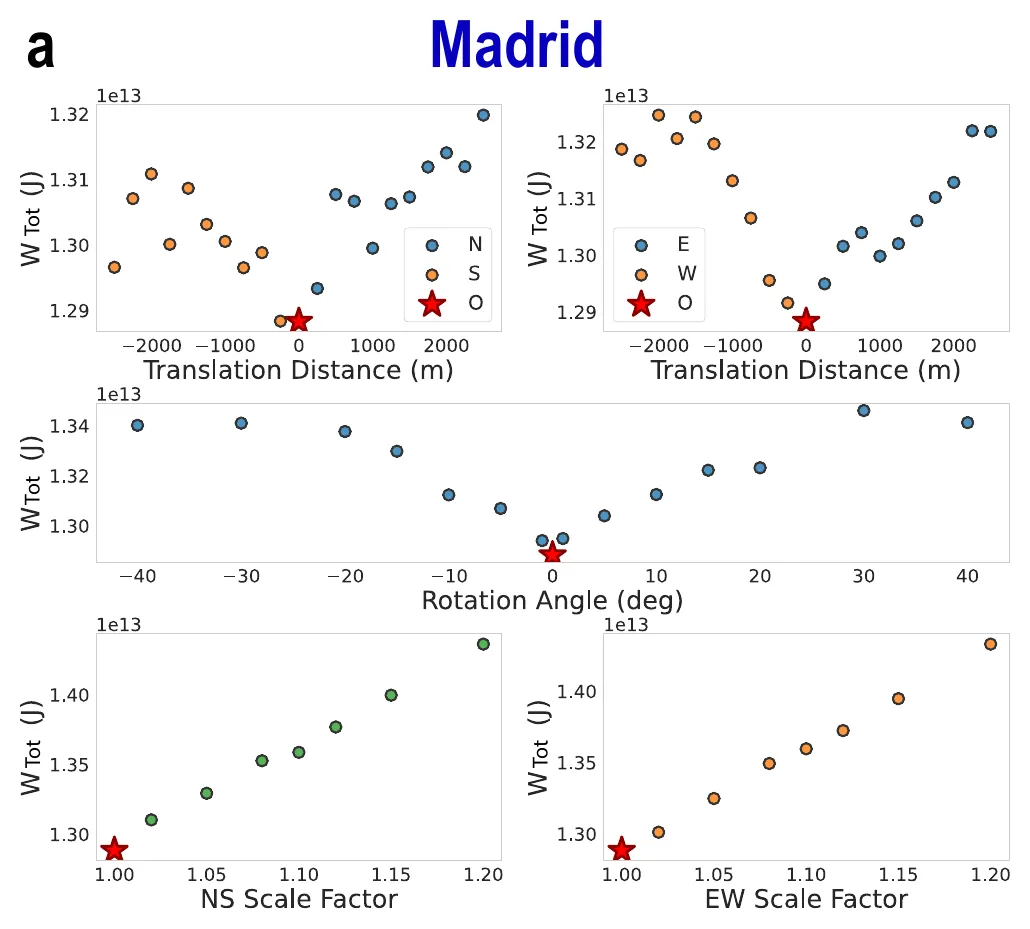
Madrid: total travel energy when the street network is shifted north–south or east–west, rotated, or stretched. The red star, the real city, sits at the bottom each time. — Figure 4a, Bellisardi et al. (2026), arXiv:2610.21558.
26 out of 30
Of the 56 cities, 26 sit by seas, lakes or the edge of the data — Chicago and its lake, Tokyo and its bay — so most of their alternatives were rejected and the comparison is only partial. Among the remaining 30, the real layout is the lowest-energy one tested in 26. In six of those, few alternatives survived (a single one for Bangkok, Berlin, Manila and Sydney), so the authors ask readers to weigh them accordingly.
In four cities, a moved version does better, always by less than 3%: Bogotá (−2.5%), Bandung (−2.4%), Buenos Aires (−0.7%) and Brussels (−0.5%).
Bogotá’s better spot is under water
Bogotá spreads over a high plateau bounded to the east by the steep Cerros Orientales, a protected reserve. Slide it 750 metres west, away from the mountain front, and it saves 2.5%. But the city has already grown west to the Bogotá River, whose corridor holds flood-prone land, wetland restoration, flood defences and joint planning with the neighbouring towns of Cota, Funza, Mosquera and Soacha. The “cheaper” Bogotá is not a place anyone could build.
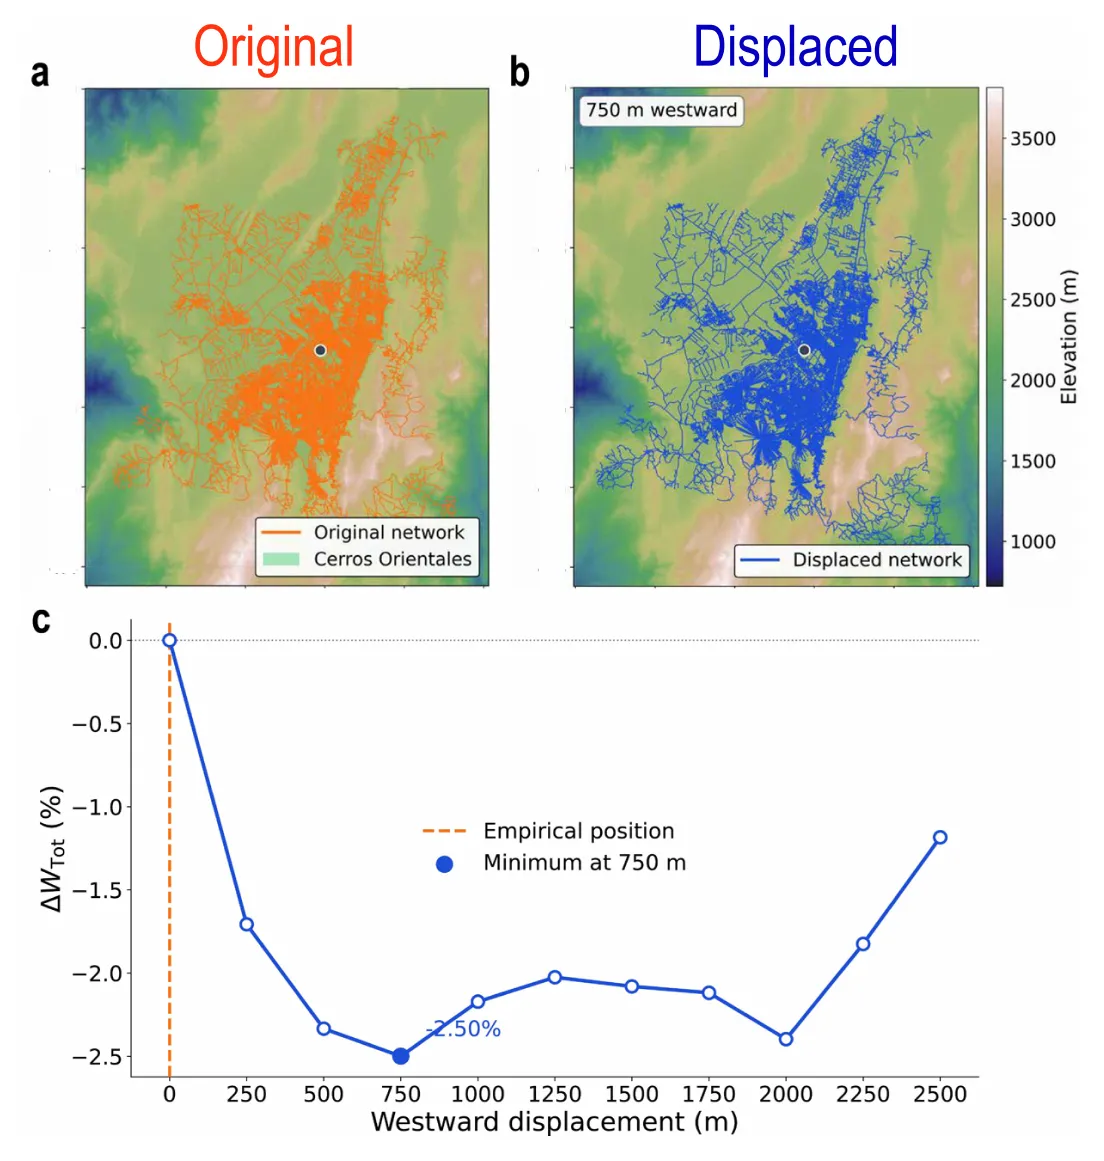
Bogotá, original (orange) and shifted 750 m west (blue), and the change in total energy as the city is moved west. — Figure 6, Bellisardi et al. (2026), arXiv:2610.21558.
The other exceptions have similar stories in the paper: Bandung’s southern option approaches volcanic highlands exposed to landslides; the Buenos Aires difference sits near the precision of the method on an almost flat plain; Brussels’ northward option runs into rail and industrial infrastructure. The authors suggest the real cities may already occupy the cheapest ground that is actually available.
Where to put 25,000 new residents
The method also works for planning. In Barcelona, the team added 25,000 residents to one of five candidate blocks with similar travel distances, and estimated their trips with a gravity model calibrated on the city’s own commuting. The extra daily energy ranged from about 266 to 322 gigajoules. The climbing part almost doubled from the best site (about 55 GJ) to the worst (about 101 GJ), and made up 46 of the 56 GJ separating them.
The authors stay careful. Their result is compatible with a slow mutual adjustment of streets, travel and terrain, but they do not reconstruct how cities grew. They tested a finite set of moves, not every possible city. The data come from Twitter/X, cars are the only mode modelled, congestion is ignored, and no African city could be included for lack of comparable mobility data. With administrative city limits instead of whole metropolitan areas, the pattern largely vanishes — a sign, they argue, that it belongs to the metropolis as a whole.