
COUNTING RECORDS TELLS YOU NOTHING ABOUT THE BIGGEST ONE
Picture a series of daily rainfall measurements. Two numbers summarise its extremes. The first is the maximum: the wettest day. The second is the number of records: how many times a day beat every day before it. The maximum is simply the last record.
Yet neither number says how the peak was reached. Was it a long staircase of records, each a little higher than the last? Or one exceptional downpour after a long calm? Intuition says the two should go together: a very high maximum ought to need many records along the way. Satya Majumdar (Paris-Saclay University and CNRS), Sanjib Sabhapandit (Raman Research Institute, India) and Grégory Schehr (Sorbonne University and CNRS) set out to compute this link exactly. Maxima and records have each been studied for decades, they note, but their joint behaviour has received “remarkably little attention”.
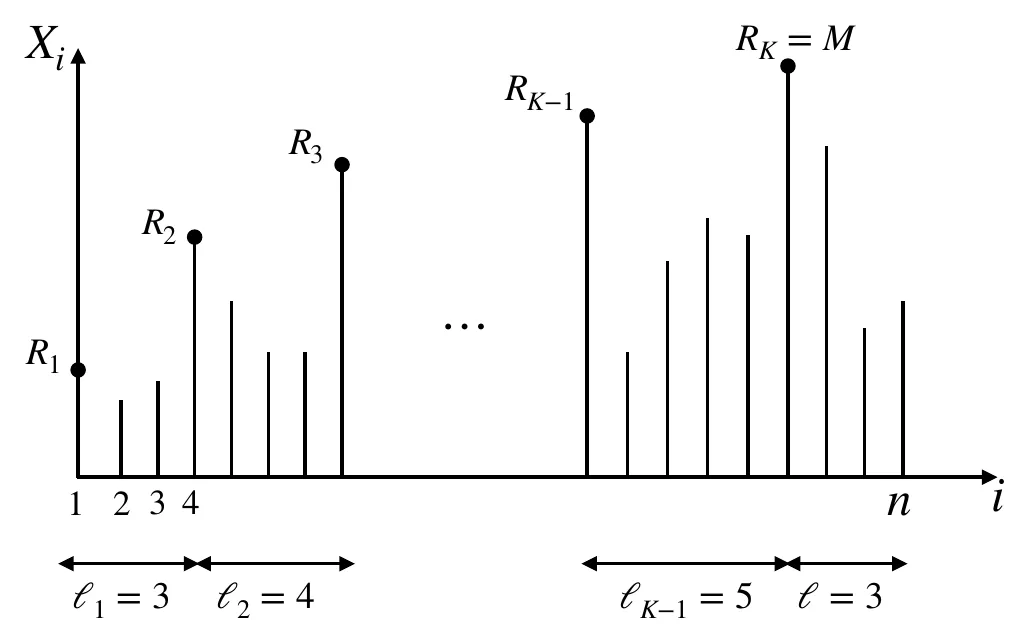
A random series of n values with K records (R₁ … R_K); the last record is the maximum M. The gaps ℓ between records are the “ages” of the records. — Figure 1, Majumdar, Sabhapandit & Schehr (2026), arXiv:2610.23217, CC BY 4.0.
Exactly no link
Start with the simplest case: each value drawn independently from the same smooth distribution, with no gaps or spikes. Here records already have a famous property: on average, a series of n values contains 1 + 1/2 + 1/3 + … + 1/n records, whatever the distribution. That number grows only like the logarithm of n — records get harder and harder to break.
The team’s first result is, in their words, “rather striking and unexpected”. For any such series, of any length, the number of records K and the maximum M are completely independent. Their joint probability splits into the product of the two separate ones. Knowing how many records were broken tells you nothing about how high the top one is, and the reverse.
Dry days change everything
Real rainfall is not smooth: some days it does not rain at all. The authors model this with a probability q of a dry day (zero rain), and a smooth distribution for the amount on wet days. Records are counted among wet days only.
Now a link appears. For a fixed number of wet days, the two quantities stay independent. It is the random number of wet days that ties them together. During a long dry spell, neither the record count nor the maximum can change: they are frozen together, and that shared freezing correlates them. Over very long series, the link fades again.
The two effects compete, and the outcome flips at a precise threshold. Below a critical dry-day share q_c, the link (measured by the covariance) only shrinks as the series gets longer. Above q_c, it first grows, peaks, then shrinks. The authors give the threshold exactly:
q_c = ½(−b + √(b² + 8)), with b = 1 + 2µ₁/µ₂
where µ₁ and µ₂ are two simple averages computed from the wet-day rainfall distribution. For exponentially distributed rain, q_c = (√33 − 5)/2 ≈ 0.372. For uniformly distributed rain, √6 − 2 ≈ 0.449. The sharpness of this switch, they write, is “surprising and far from trivial”. Over long series, the link decays as a power of the series length, with an exponent set by how heavy the tail of the rain distribution is, not by q.
Checked against German rain
To test the prediction, the team turned to daily data from the German weather service, the Deutscher Wetterdienst: 6,105 stations. To remove the day-to-day memory of weather, they kept only one day in thirteen. Then they built two groups:
- Group A: 232 stations with complete records from 1974 to 2013 and about half the days dry (q ≈ 0.50). The predicted threshold for their rain was 0.315, so the link should rise, then fall.
- Group B: the November records of 15 stations with few dry days (q ≈ 0.23), below their predicted threshold of 0.28. The link should only fall.
The theory used only the measured share of dry days and the measured rainfall distribution, with no adjustable parameter. Both groups followed the predicted shape.
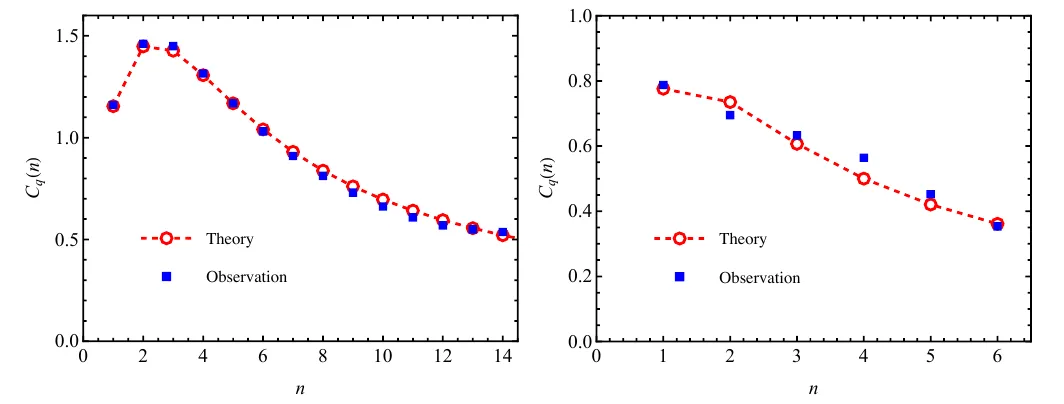
German rainfall data (blue squares) against the exact theory (red). Left: stations with about 50% dry days, above the threshold — the link rises, then falls. Right: November data with 23% dry days, below the threshold — it only falls. — Figure 3, Majumdar, Sabhapandit & Schehr (2026), arXiv:2610.23217, CC BY 4.0.
Real rainfall also carries memory from one day to the next. The authors’ preliminary work on series with such memory suggests the link then always rises before it falls, whatever the strength of the memory — the next calculation they would like to make exact, dry days included.