WHEN LANE ASSIST LOSES THE LINES, IT OFTEN KEEPS QUIET
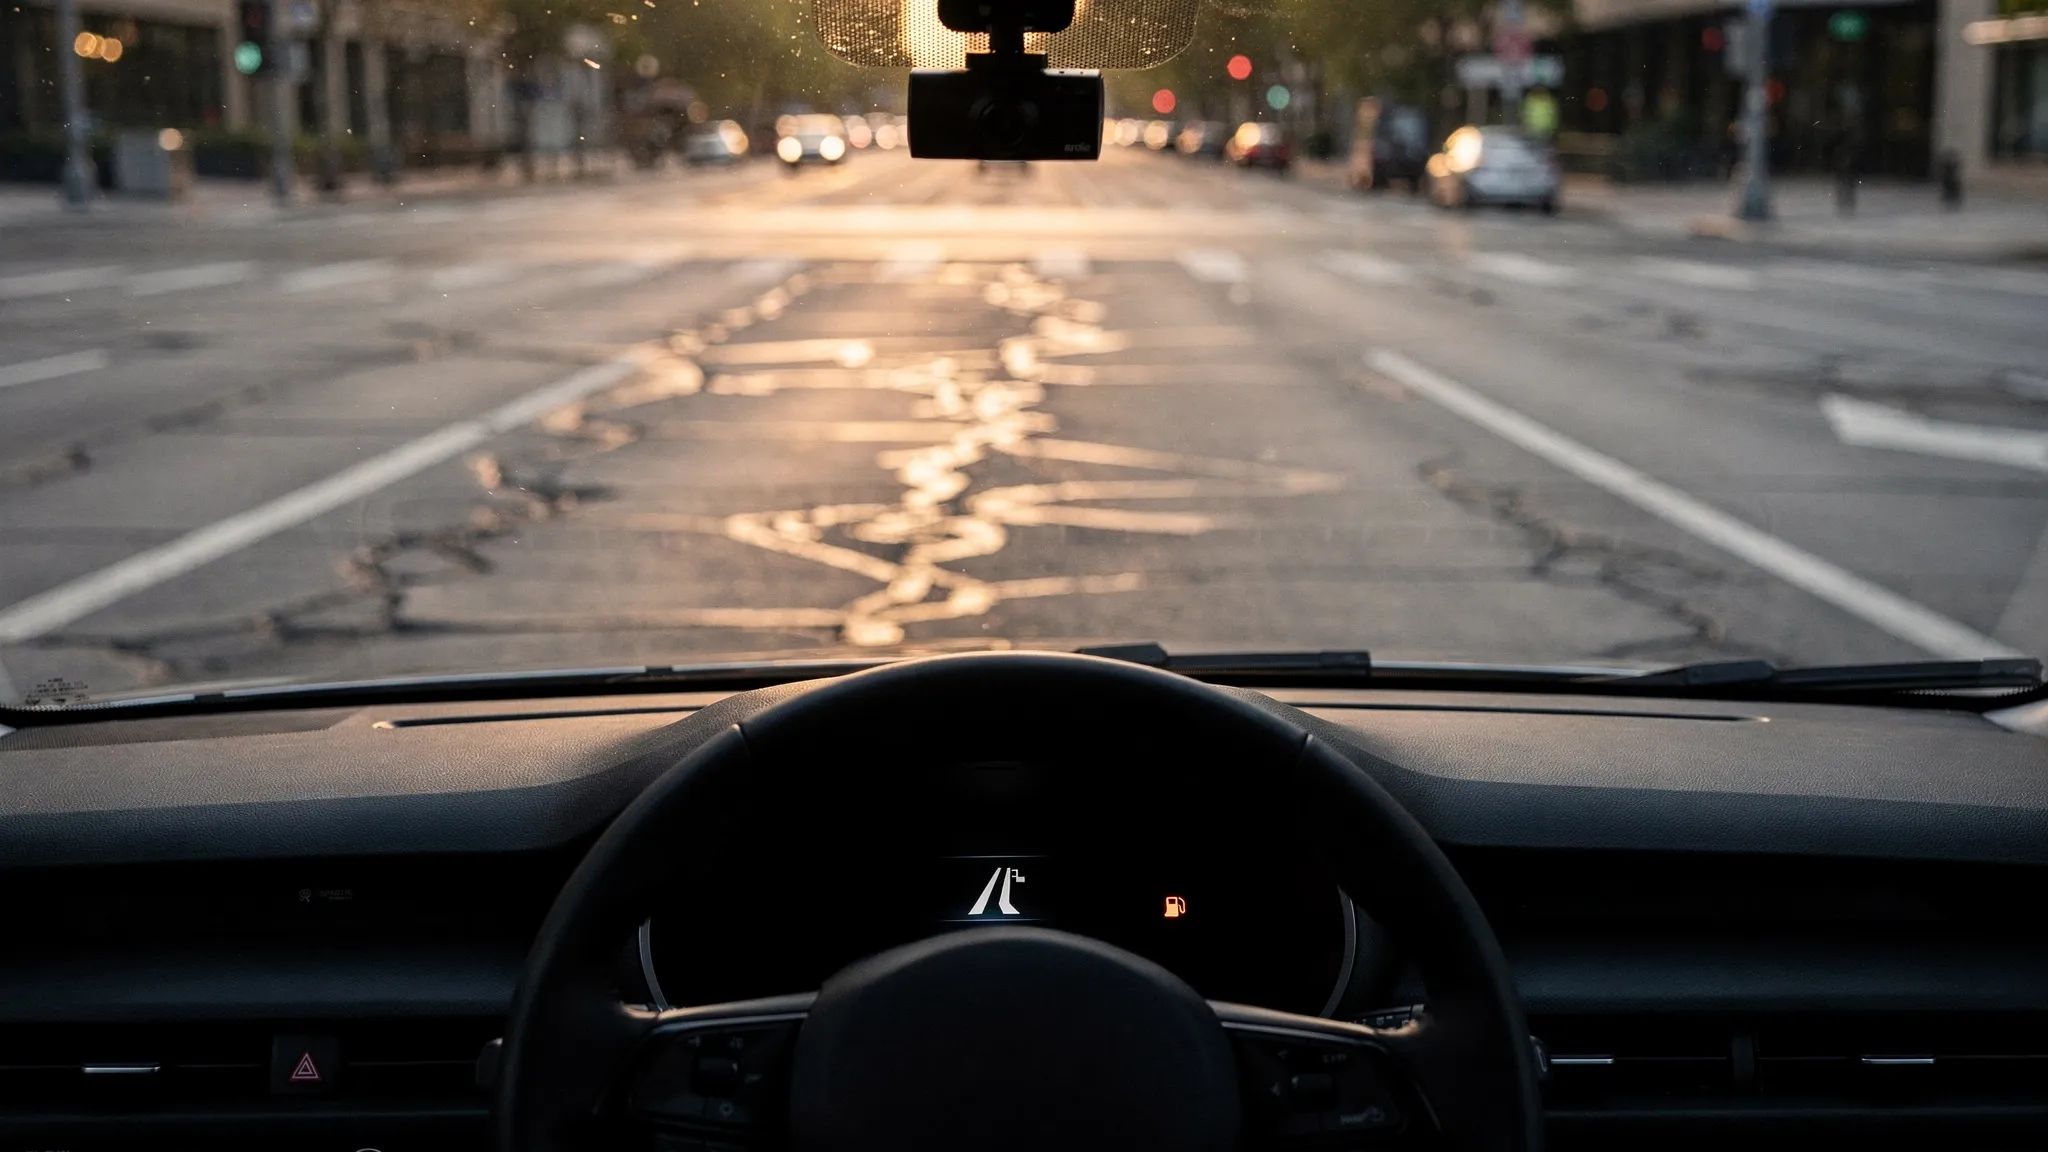
Lane keeping assist went from 1.4% of new American vehicles in model year 2015 to 86.3% in model year 2023, according to a MITRE report cited in the study. A camera reads the painted lines ahead and helps steer the car between them; worn paint, low contrast or bad weather can blind it. The driver’s only explicit report of what it sees is a status on the dashboard: lane detected, or not detected.
That status can be wrong in two ways. It can say “not detected” when the camera is fine — a nuisance alert that, repeated, teaches drivers to ignore it or switch the function off. Or it can keep saying “detected” after the camera has lost the lines. The authors call the second error the more damaging one: the driver gets no signal at the very moment a lane departure is most likely.
Three witnesses, no judge
Checking that status is hard. Production systems are proprietary: only the status broadcast on the car’s internal network, the CAN bus, is visible. And there is no reliable record of how visible a line really is at a given second.
Tianjia Yang, Xianbiao Hu and colleagues at The Pennsylvania State University and Stony Brook University built a method they call CANDID-LKA. For each second of driving it compares three signals: the status the car displays, the confidence of a separate camera system on the windshield watching the same road, and how hard the driver turns the wheel.
None of the three is taken as the truth. A latent-class model, a method borrowed from medicine to judge diagnostic tests when no perfect reference test exists, treats them as three imperfect witnesses of a hidden state — lines hard to see, or not — and works out from their pattern of agreement how often each one is right.
The data come from the difficult-driving subset of the public OpenLKA dataset, recorded around Tampa, Florida, and across the United States. After screening, 39,800 seconds remained, from 13 models by three makers: Toyota and Lexus counted together (8 models), Hyundai (4 models) and Honda (a single model, 4,451 seconds).
A status that follows the car, not the road
First question: does the status react to the conditions that make lines harder to see? Not consistently. Markings hidden from view (occluded) came with more “not detected” seconds — about 30% against 20% on clear ones — but the difference was not statistically significant, and faded or low-contrast paint made almost no difference. Which car it was explained most of the variation in the status.
The makes even moved in opposite directions. On faded markings, Hyundai said “not detected” more often than on clear ones (23% of seconds against 14%), Toyota less often (21% against 31%): its status lost the lines about as often, but seems to have come back faster.
Half the warnings never come
According to the model, the lines were hard to see in 13% of seconds. The separate camera flagged 80% of them. The dashboard status flagged 47% — 46% for Toyota, 44% for Hyundai, 79% for Honda. A plain count, without the steering signal, gives nearly the same figure (45%): “not detected” in 1,818 of the 4,054 seconds when the separate camera’s confidence was low.
In half of the stretches of two seconds or more when that confidence stayed low, the status never switched to “not detected” at all. When it did warn, it warned right away. The failure is not a late warning; it is no warning.
Drivers did steer hard more often after silent seconds — status “detected” while the separate camera was unsure — than when both agreed the lane was seen: 27% against 6%. But once the curve of the road was taken into account, the difference vanished: drivers steered for the road, not for the icon.
Forty-eight seconds an hour
In this difficult driving, silent seconds added up to 216 seconds per hour. In 78% of them the driver was already steering, mostly through sharp turns at around 29 km/h.
The other 22%, 48 seconds per hour, are the ones the authors single out: the driver applies little force to the wheel, leaving the steering to the system, and the dashboard gives no warning. Two thirds were on straight road. Over the next three seconds, the car’s side-to-side wander in its lane — the standard deviation of its lateral position — had a median of 12.2 cm, against 4.2 cm after seconds when status and camera agreed and the driver was not steering either. Adjusted for speed, curvature and car model, silent seconds still add 5.4 cm of wander; the authors call this “about 60% more”, without stating the baseline behind that percentage. The car’s position in the lane varied by more than 50 cm in 46% of these windows, against 6%. The extra wander appeared on clear, low-contrast and faded markings, by day and by night, in town, in the country and on highways.
Noisy rulers and shared blind spots
The wander is measured by the separate camera, whose readings get noisier when its confidence is low, as during silent seconds; the authors call the result an association, while noting the gap is as large on clear markings in daylight. The two cameras look at the same road and may fail together — which, their checks show, would make the dashboard status look better than it is. Cars, routes and sample sizes differ between makes, so this is no causal verdict on brands. One-minute clips cut off long outages. And every figure describes difficult driving, not an ordinary commute.
Nor is the hidden state ever checked against scenes labelled by human reviewers. What the study does pin down is a count: in this difficult driving, 48 seconds in every hour when the lane keeping was left to the system and the dashboard gave no warning.