THEY NAMED WHERE THE QUAKE WOULD START
Long-term earthquake forecasts give the probability that a stretch of fault will break within a given period. For the central and southern parts of the Hinagu fault zone, in central Kyushu, Japan, the official estimate was up to 6% and 16% over 30 years. What such forecasts never say is where on the fault a rupture will begin.
A meter for stress
Seismologists count earthquakes by size. The number N of quakes of magnitude M or larger follows the Gutenberg–Richter law, log₁₀N = a − bM. The slope, called the b-value, sets the proportion of small earthquakes to large ones. Laboratory experiments and studies of the Earth’s crust show that it falls as stress — the squeezing and shearing load on the rock — rises. Mapped in space and time, it becomes a stress meter: low b-values mark the most loaded parts of a fault.
The idea has a history. At Parkfield, California, a b-value map published seven years before the magnitude 6.0 earthquake of 2004 marked the patch that would slip. It did not say where the rupture would start, and the authors of the map called the actual starting point a surprise. For many other large earthquakes, the low b-value was only noticed afterwards, too late to test it.
A rectangle on the map, in 2019
In April 2016, the Kumamoto sequence — magnitude 6.5, then 6.4, then 7.3 — broke the northern part of the Hinagu fault zone and the neighbouring Futagawa fault zone. The central and southern parts of Hinagu did not break.
K. Z. Nanjo and colleagues mapped the b-value from January 2017 to March 2019, using the catalogue of the Japan Meteorological Agency. Everywhere along the two fault zones, b rose after 2016, a sign that stress had been released. Everywhere except one place: the centre of the Hinagu fault zone, where it fell. Two other clues pointed to the same spot: the way aftershocks were dying away there, and a model of the slow slip that followed 2016, which stopped just short of it.
In 2019, the team published that area — a rectangle spanning 130.6–130.8°E and 32.5–32.6°N — as the place where the next rupture was most likely to begin, and announced it at a press conference at the Kumamoto prefectural government.
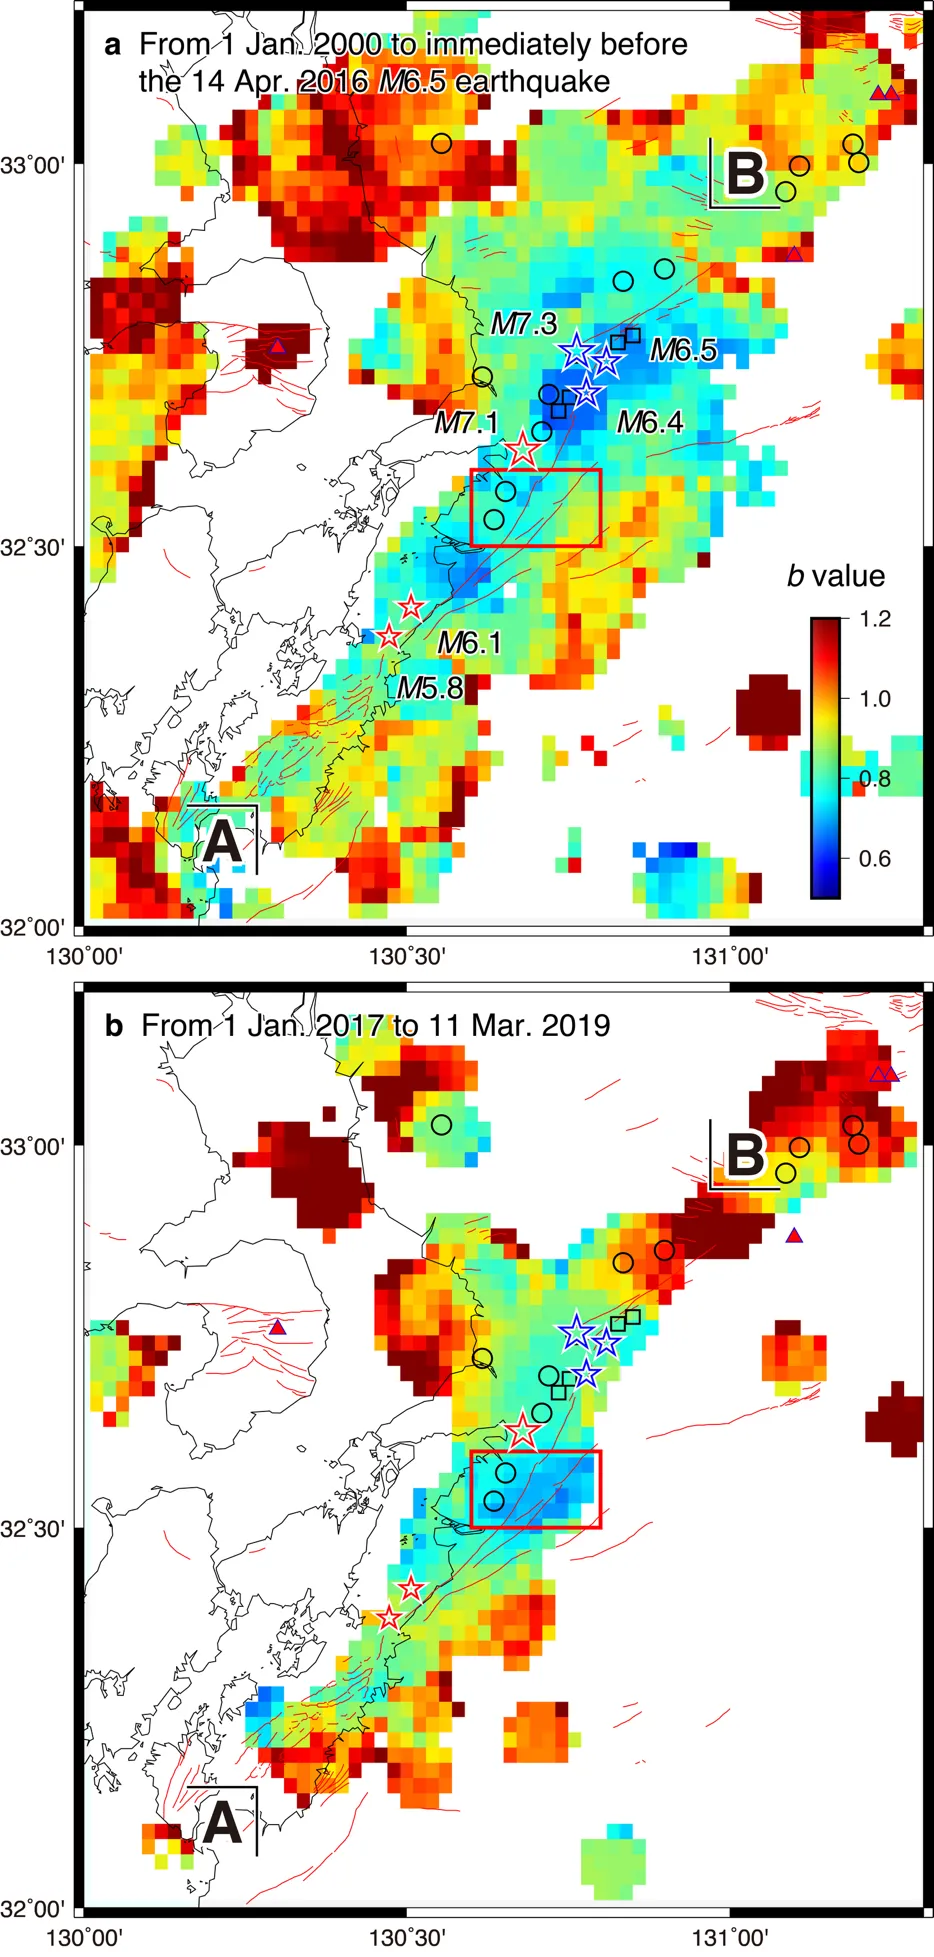
b-value maps before 2016 (a) and from January 2017 to March 2019 (b): blue means low b-values. The red rectangle is the area named in 2019; red stars mark the 2026 earthquakes. — Figure 2, Nanjo et al. (2026), arXiv:2610.39393.
Seven years later
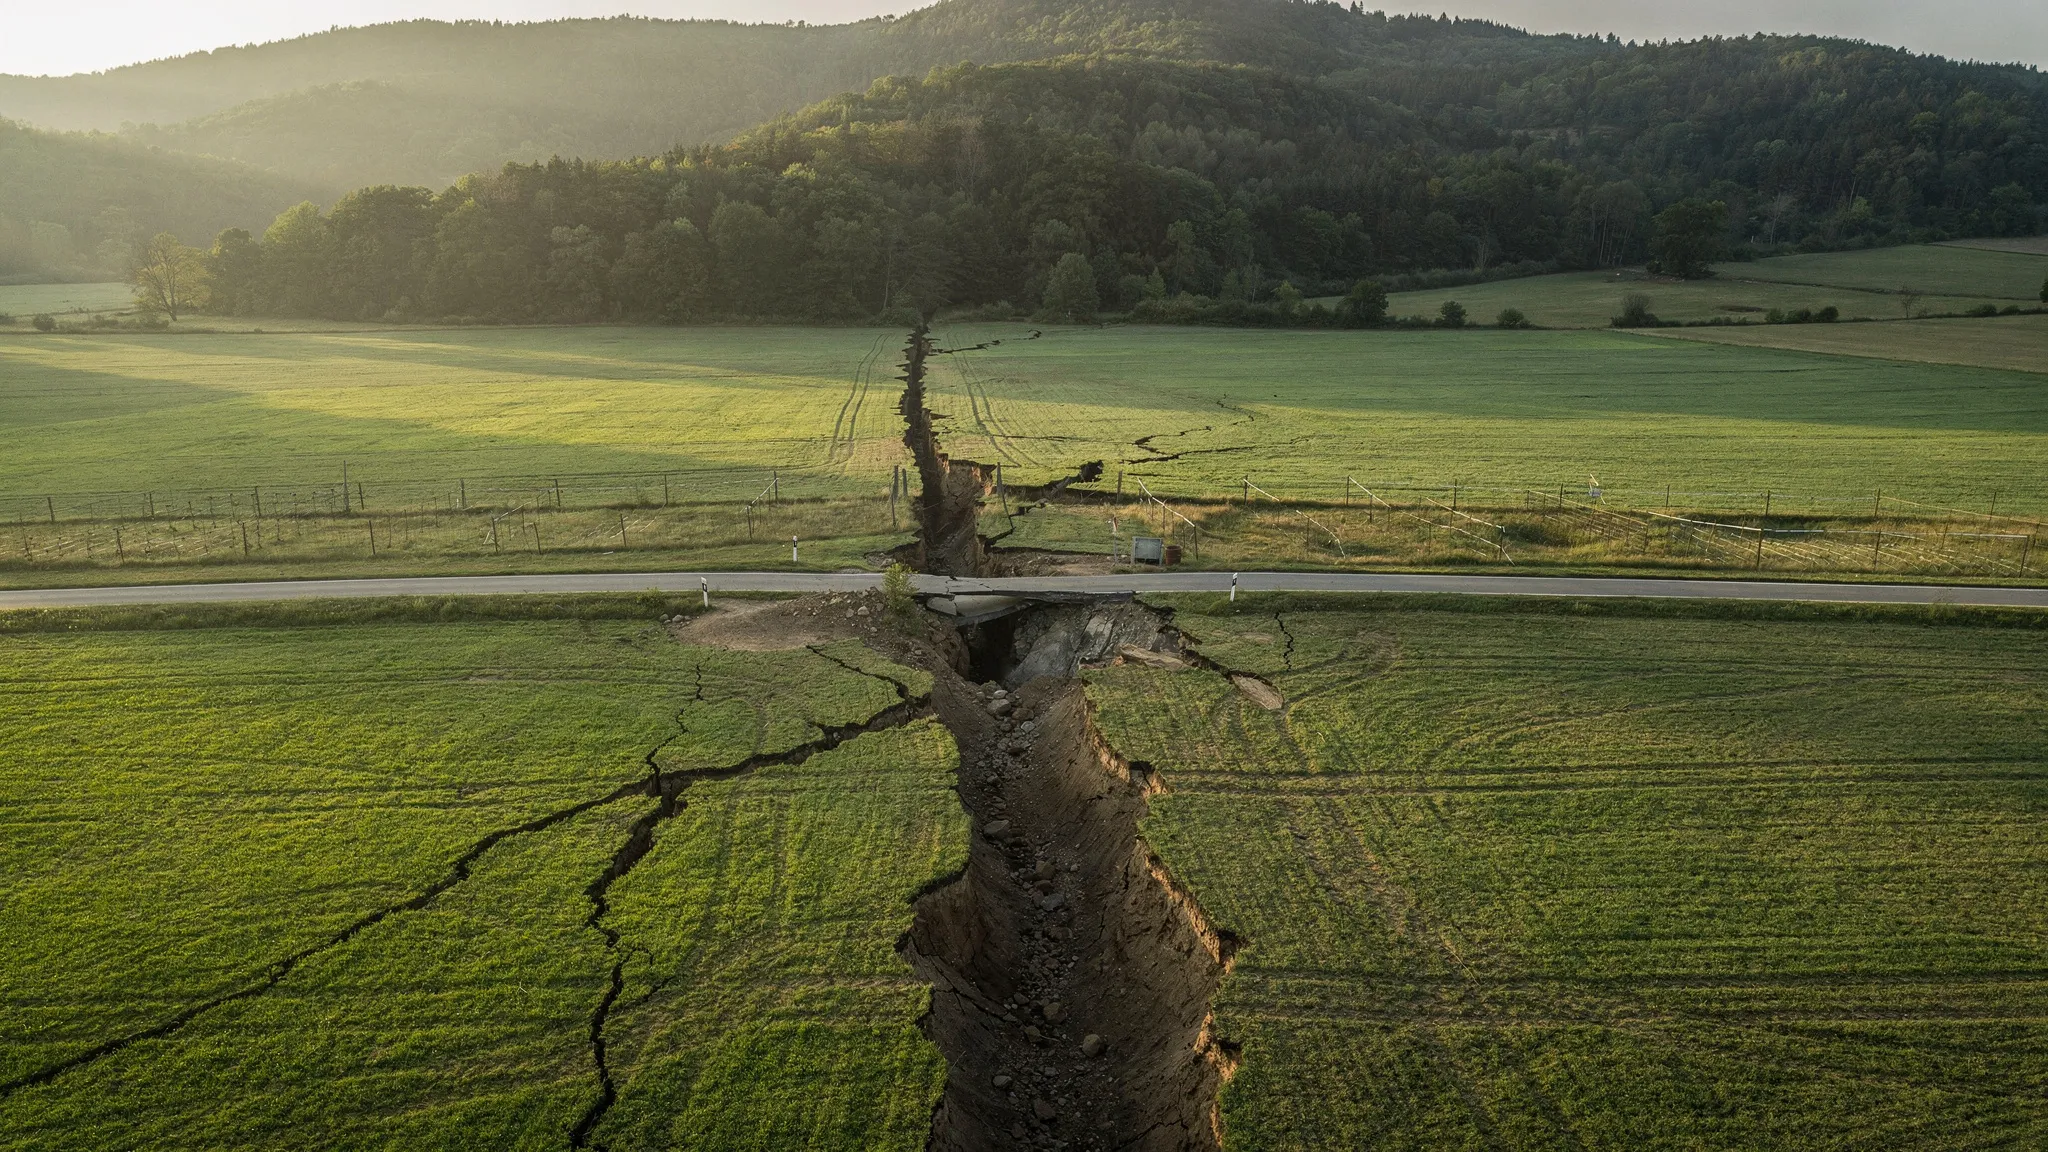
On 28 July 2026, a magnitude 7.1 earthquake struck the central part of the Hinagu fault zone and ruptured the ground surface. The very next day, the team showed its 2019 map to Japan’s Earthquake Research Committee.
On the map, the epicentre — the point on the surface directly above where the rupture began — lies just outside the rectangle, 2.9 kilometres from its northern edge: less than the 5-kilometre radius over which each point of the map gathers its earthquakes, so within the map’s sharpness. But a map merges every depth down to 25 kilometres, while a rupture starts at one point underground. In a vertical slice along the fault, the low-b zone extends downward, and the 2026 starting point, 16 kilometres deep, sits inside it, where b is 0.6–0.7. In two independent preliminary models, the zone of large slip — more than 1.2 metres — crossed the area named in 2019.
The low values were still there just before the earthquake. Afterwards, b around the starting point rose to 0.9–1.2, as expected once stress is released. To the authors’ knowledge, this is the first starting point of a large earthquake named in print beforehand.
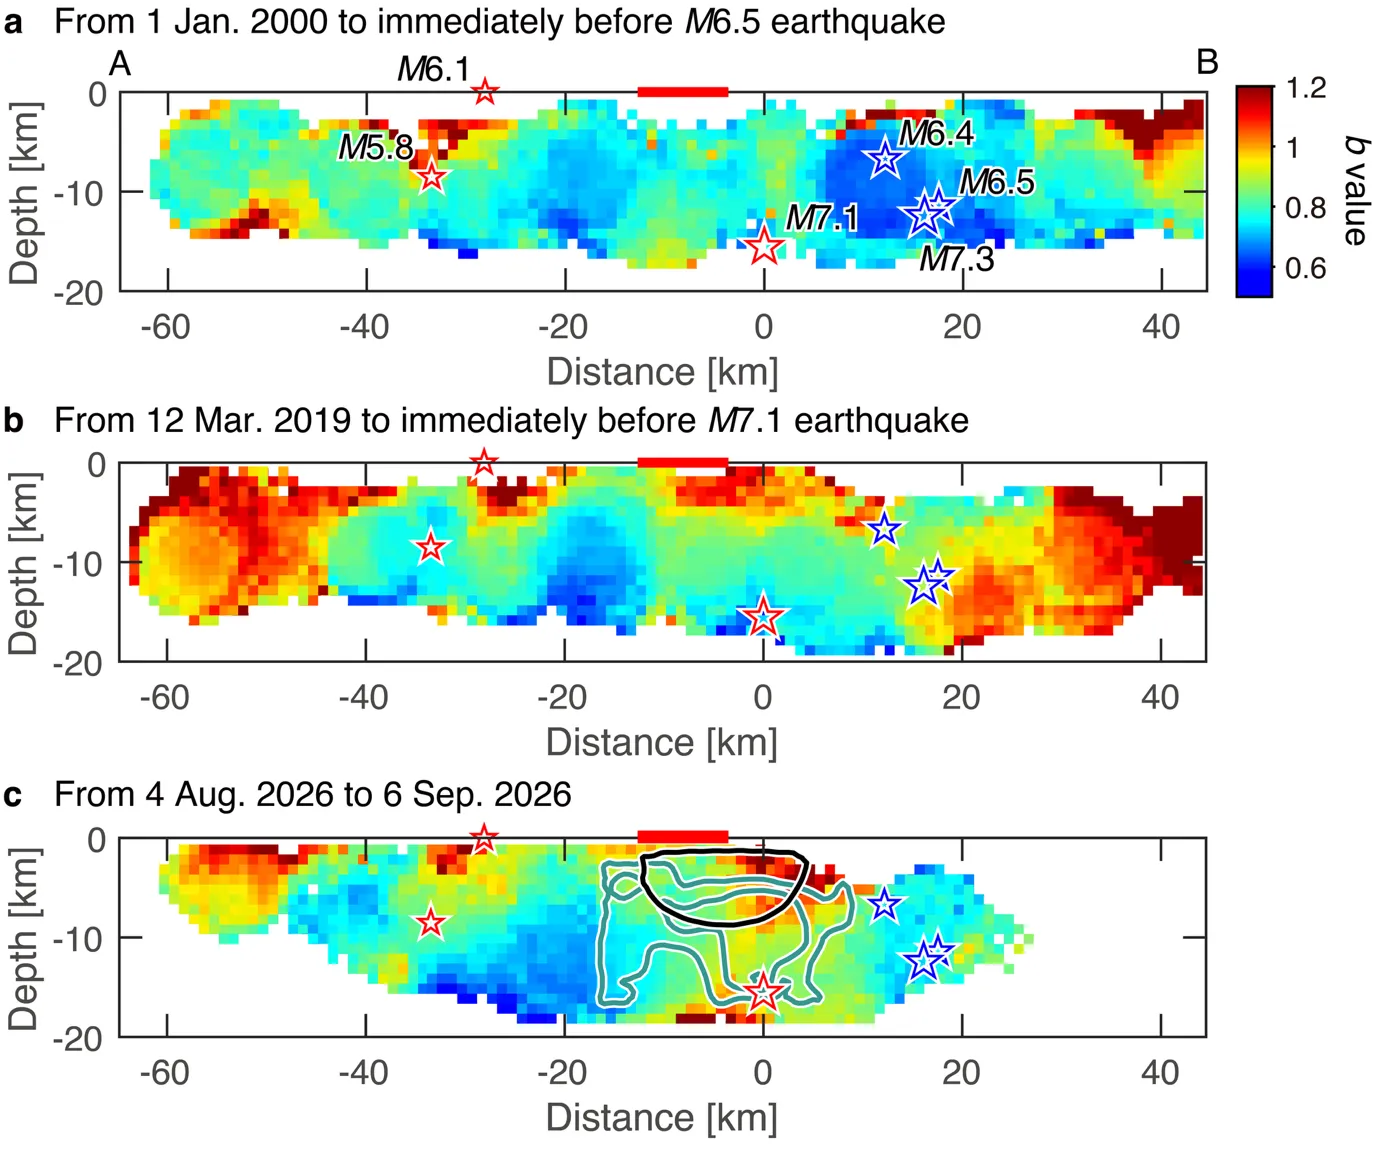
b-values in a vertical slice along the Hinagu fault: before 2016 (a), just before the 2026 earthquake (b) and after it (c). The magnitude 7.1 began at the 0-km mark along the slice, 16 km deep, inside a blue low-b zone. — Figure 4, Nanjo et al. (2026), arXiv:2610.39393.
The next candidate
The slice shows another low-b zone, about 20 kilometres southwest of where the 2026 rupture began, right where its large slip ended. It sits at a bend in the fault, where the fault changes direction — a bend already mapped by a field survey before the earthquake. The 2016 sequence, too, began at a bend with low b-values. This zone has kept low b-values since 2000, through both sequences: neither released its stress. As in 2019, the authors name it as the place where the next rupture is most likely to begin.
From there, a rupture could run southwest, under the Yatsushiro Sea. Earthquakes are too rare there to measure b, so the team computed how the 2026 slip changed the stress on those faults. The answer: it pushed them closer to failure, with maxima of 0.9 to 1.7 bar at their northeastern end, depending on the model. These are the very faults the official assessment already gave the highest odds — up to 16% in 30 years.
A place, not a date
“One earthquake cannot show how well a method works,” the authors write. To judge it, the same steps must be applied to other faults, with every choice recorded before the earthquakes arrive. The data already exist: networks in Japan, California, Chile, Italy and Türkiye record even small quakes, year after year. The zone named in 2019 waited seven years for its earthquake, and nothing in the b-value says when the next one will come. What it offers is a place to watch, so that preparedness there can be reviewed before the earthquake rather than after it.