MANHATTAN'S TOLL: 42% LESS TRAFFIC?
Since 12:01 a.m. on 5 January 2025, nearly every vehicle entering Manhattan south of 60th Street, the street itself included, pays a charge. For a car it is $9 at peak hours (5 a.m. to 9 p.m. on weekdays, 9 a.m. to 9 p.m. at weekends) and $2.25 otherwise, once a day, on entry only. According to the paper, New York is the first US city to run a permanent cordon toll: you pay to cross a line drawn around a district.
The economic idea is old. Each driver slows everyone else down without paying for it; a charge equal to that hidden cost makes drivers take it into account. Stockholm, Milan, London and Singapore saw double-digit drops in traffic after their tolls, mostly at peak hours: about 20% in Stockholm.
Streets north of 60th as the yardstick
Yash Prajapati, at the University of Kansas, uses a method called difference-in-differences. The study compares how traffic changed inside the zone with how it changed, over the same period, on Manhattan streets just north of it, roughly between 60th and 110th Street: same weather, same transit, same citywide shocks, but no toll. What hits both groups cancels out; what remains is put down to the toll, provided both groups would have moved in step without it.
The counts come from the city’s automatic traffic recorders, January 2023 to February 2026. The model also accounts for each street’s usual traffic, the calendar, the weather and holidays. It works on the logarithm of hourly traffic, a scale on which equal steps mean equal percentage changes; a coefficient on that scale is not itself a percentage, and the author converts it with 1 − e^coefficient.
41.7%, on paper
- Main estimate: −0.539 on the log scale, which the author converts into 41.7% fewer vehicles per hour inside the zone, relative to the streets north of it.
- Before the toll, the counted streets inside the zone carried 1,447 vehicles per hour on average: the estimate means about 603 fewer per hour on each.
- Raw averages are gentler: −15% inside the zone (1,447 to 1,230), +4% north of 60th Street (812 to 842).
- The drop is larger at peak-price hours (−0.484 on the log scale) than off-peak (−0.314), as theory predicts (the peak toll is four times the off-peak one), though neither figure is statistically significant (that is, clear enough to rule out chance).
- Counted in vehicles rather than logs, the same comparison gives only −107 vehicles per hour per segment (p = 0.08), more than five times fewer than the 603 above, a gap the paper does not explain. The sign stays negative in every robustness check.
The author notes that 41.7% is roughly twice the Stockholm figure, and that this “warrants caution”.
Three road segments and a wide margin
The city’s recorders move from site to site, so although the counts start in January 2023, the model keeps only counters observed for at least 48 hours both before and after the toll. Inside the zone, that leaves three road segments: East 58th Street and the two directions of the Williamsburg Bridge approach, with just 360 hours (15 days) of counts before the toll and 216 (9 days) after.
The uncertainty is huge. The main estimate has a p-value of 0.24: if the toll had done nothing, an estimate this far from zero would still turn up about one time in four. Its 95% confidence interval (the range of values compatible with the data), from −1.44 to +0.36 on the log scale, includes zero and even positive values: more traffic. The author calls the result “direction-consistent” but “statistically underpowered”, and blames the small number of counters rather than a small effect.
Two checks add doubt. Pretend the toll started a year earlier, on 5 January 2024, and the model still finds a negative estimate (−1.03, not significant). The author calls it a “yellow flag”: part of the decline may come from changes in which counters were active, not from the toll. And the week-by-week check that both groups moved in step rests on only 9 weeks before the toll. Hour by hour, the picture is just as blurred.
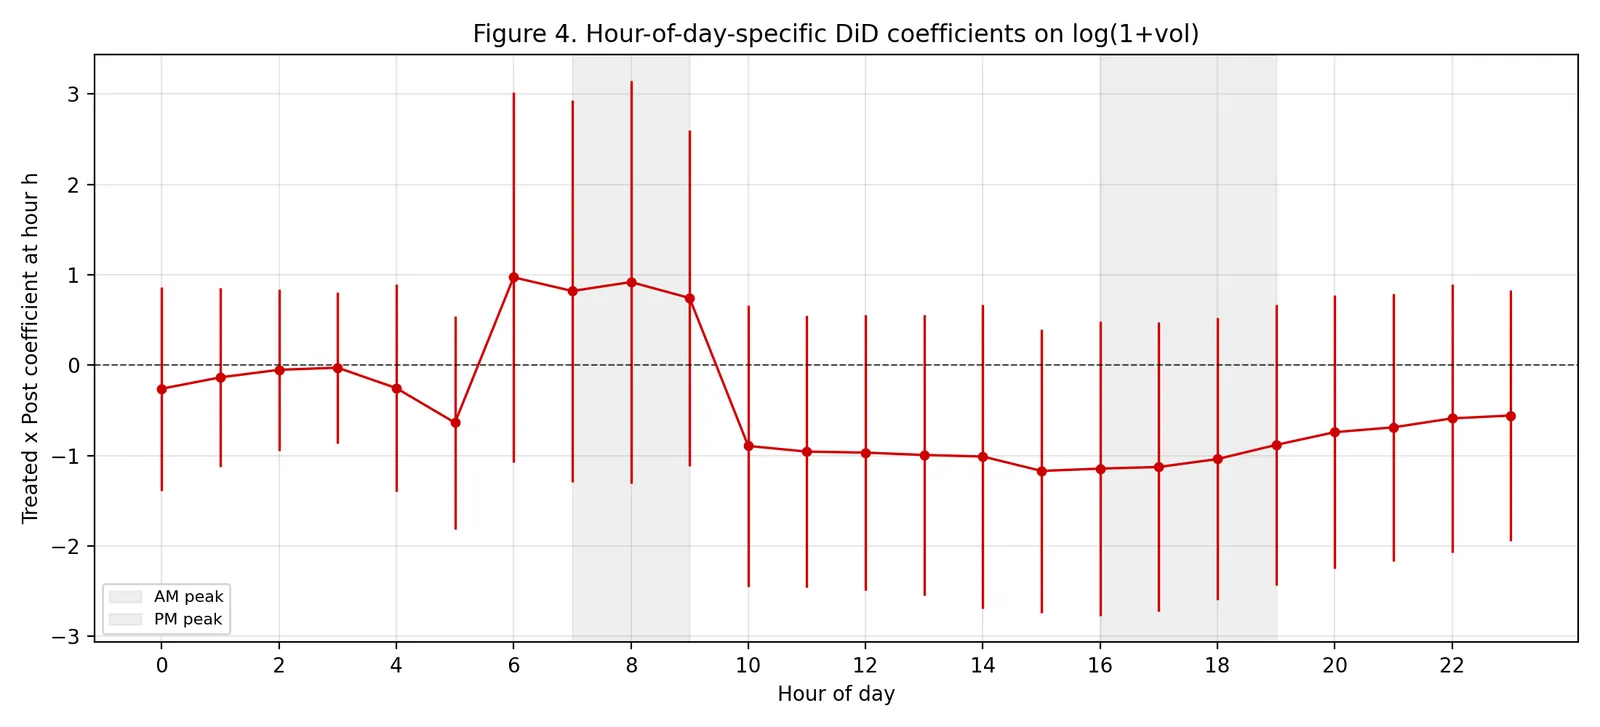
The toll’s estimated effect hour by hour, on the log scale: positive from 6 to 9 a.m., negative from 10 a.m. into the evening, and every 95% interval (vertical bars) crosses zero. — Figure 4, Prajapati (2026), arXiv:2610.34818.
Traffic that may have gone around
On the bridges in the sample, traffic rose by 25% after the toll began (+0.227 on the log scale, p = 0.036), one of the study’s few statistically significant results. North of 60th Street, the change is essentially zero. The author sees it as consistent with drivers switching routes, but the group mixes the Williamsburg Bridge approaches, inside the zone, with two bridges linking Manhattan north of 60th Street to the Bronx: on its own, it cannot show why traffic rose.
4.86 million entries, all after
The toll meters are far denser: 4.86 million ten-minute records of entries into the zone, 5 January 2025 to 18 April 2026. On weekdays, entries climb steeply to a morning peak around 8 a.m., then hold a broad plateau through the afternoon; at weekends they rise slowly to a mid-afternoon plateau. The author links this flattened rush hour to the long, 16-hour peak-price window.
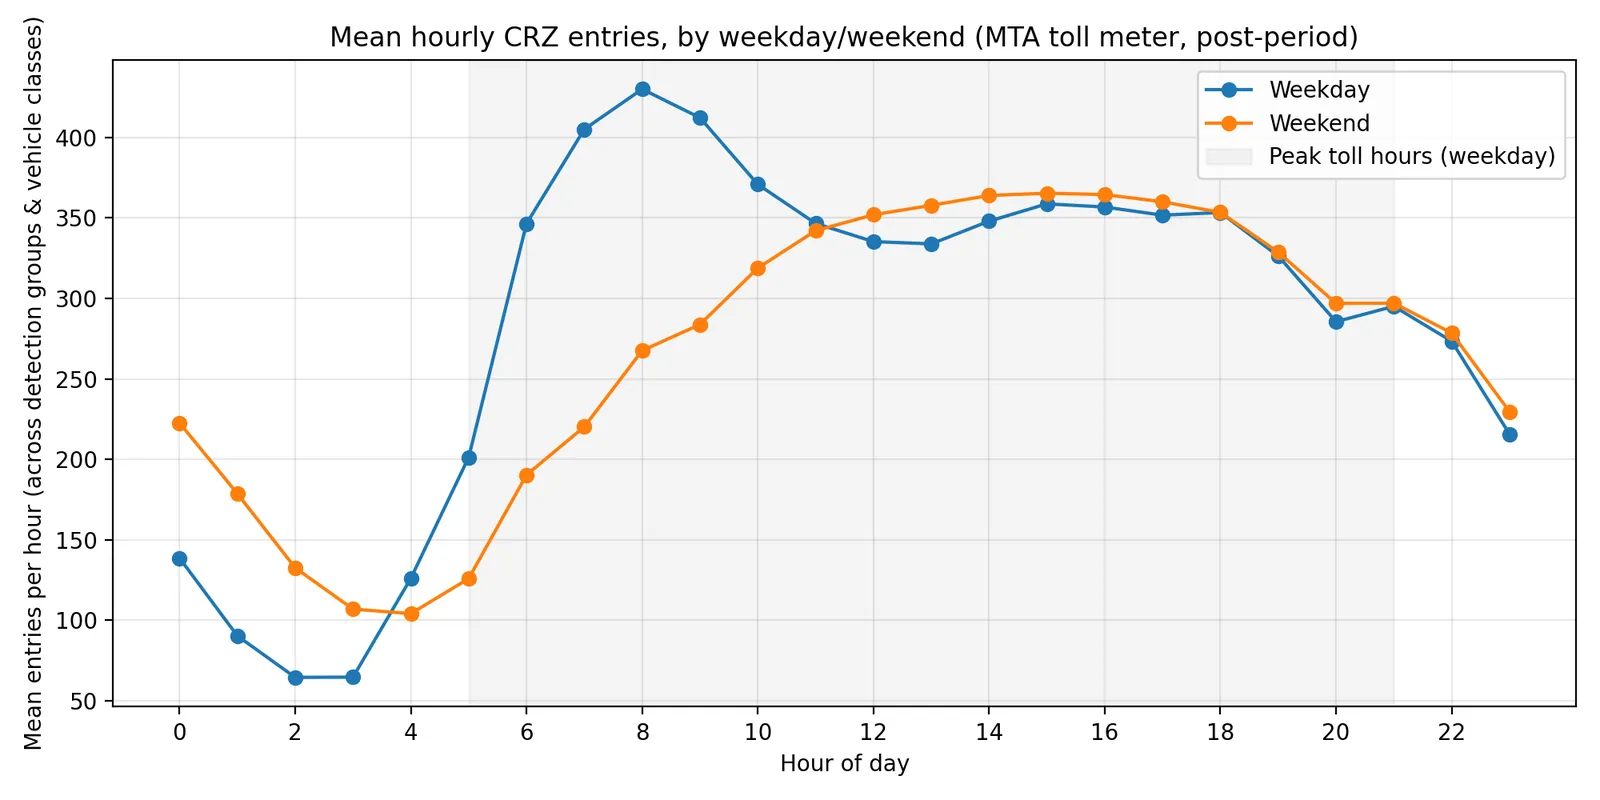
Average entries into the zone per hour after the toll began, on weekdays (blue) and at weekends (orange), averaged across detection points and vehicle classes; the grey band marks weekday peak-price hours. — Figure 7, Prajapati (2026), arXiv:2610.34818.
These records begin on the day the toll did. They show how the zone is used now, not how much traffic it lost.